Playwright Visual Regression Testing: Complete Guide (2026)
Introduction: Why “It Looks Fine to Me” Isn’t a Testing Strategy
I’ve lost count of how many times a functional test suite has gone fully green while the actual product shipped with a broken layout. A button overlapping text. A CSS variable that silently stopped resolving after a design system update. A font that failed to load in production and pushed every heading onto two lines. Every assertion passed. The DOM structure was correct. The API responses were correct. And the UI still looked broken to a real user.
This is the blind spot that traditional end-to-end automation has always had. Selenium, Cypress, and Playwright’s own functional API assertions are excellent at confirming that an element exists, that it has the right text, that a click triggers the right navigation. None of that tells you whether the element is visually where it’s supposed to be, whether it’s the right color, whether it’s overlapping something else, or whether a third-party CSS change silently nuked your spacing.
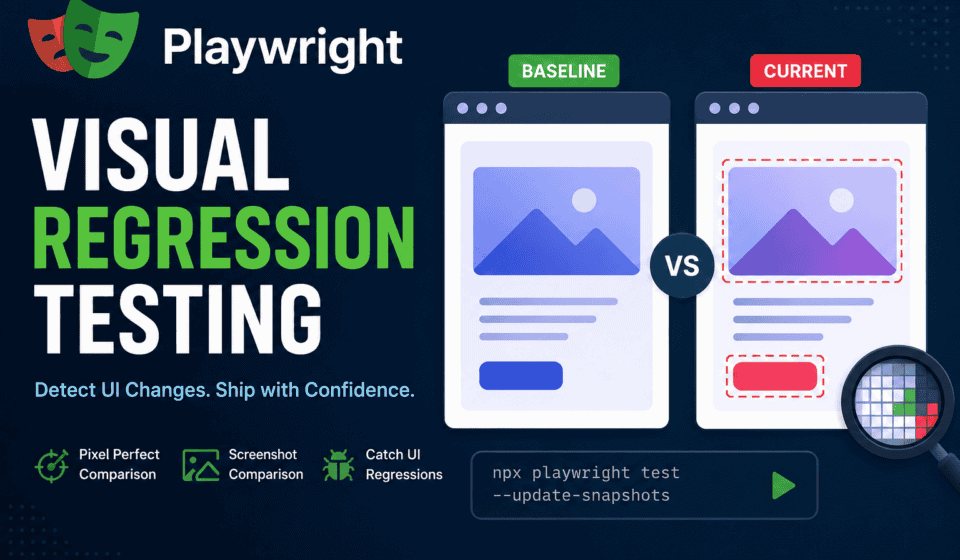
Playwright visual regression testing closes that gap. It’s the practice of capturing screenshots of your application’s UI at a known-good state (a “baseline”), then automatically comparing every future run against that baseline pixel-by-pixel, flagging anything that changed. If someone tweaks a CSS file and it shifts your entire pricing table two pixels to the left, a well-configured visual regression suite catches it in CI before a human ever sees it in staging, let alone production.
This guide is the complete reference I wish I’d had when I started building visual regression suites with Playwright. It’s written from the perspective of someone who has actually run these suites in CI against real product codebases — not just a documentation summary. I’ll cover the theory, the exact configuration options and what they actually do, the failure modes you will hit (dynamic content, font rendering differences, anti-aliasing across operating systems), how to wire this into CI/CD reliably using Docker, how to manage baselines at scale, and how Playwright’s built-in visual testing stacks up against dedicated platforms like Percy, Chromatic, and Applitools.
By the end, you should be able to design, implement, and maintain a Playwright visual regression testing strategy for Playwright that doesn’t collapse into flaky noise within a month — which, if you’ve tried this before and abandoned it, is probably exactly what happened to you.
What Is Visual Regression Testing? (And Why It’s Different From Screenshot Testing)
Visual regression testing (VRT) is a testing technique where you capture a reference image of a UI component, page, or full application state, store it as a “baseline,” and then compare subsequent screenshots against that baseline using pixel-diffing algorithms. If the difference between the new screenshot and the baseline exceeds a configured threshold, the test fails and the specific pixels that changed are highlighted in a diff image.
It’s worth being precise about terminology here because people use “screenshot testing” and “Playwright visual regression testing” interchangeably, and that’s not quite accurate:
- Screenshot testing is the mechanical act of capturing an image of a rendered UI state. It’s the raw capability.
- Visual regression testing is the discipline built on top of screenshot testing: baseline management, diff thresholds, masking dynamic regions, CI integration, and a review/approval workflow for legitimate UI changes.
You can do screenshot testing without Playwright visual regression testing (e.g., capturing a screenshot purely for debugging or documentation). But you can’t do Playwright visual regression testing without screenshot testing as the underlying mechanism.
How Pixel Diffing Actually Works
Under the hood, Playwright’s screenshot comparison (and most VRT tools) uses a perceptual diffing algorithm rather than a naive byte-for-byte comparison. Playwright uses pixelmatch, a pixel-level image comparison library originally built by Mapbox. Pixelmatch works by:
- Converting both images into the YIQ color space (which separates luminance from chrominance, closer to how human vision perceives contrast).
- Comparing each corresponding pixel pair between the baseline and the new screenshot.
- Flagging a pixel as “different” if the perceptual color distance exceeds a configurable threshold.
- Optionally applying anti-aliasing detection so that sub-pixel rendering differences (which are common and usually meaningless) don’t get flagged as regressions.
This matters because a byte-for-byte comparison would fail constantly — even two screenshots of the exact same static page, rendered a second apart, can differ at the byte level due to font hinting, GPU rendering non-determinism, or compression artifacts. Perceptual diffing with a tolerance threshold is what makes Playwright visual regression testing usable in practice instead of a permanently red pipeline.
What Visual Regression Testing Catches That Functional Tests Don’t
In my own QA practice, the categories of bugs that visual regression has caught that would have otherwise reached production include:
- CSS specificity collisions — a new stylesheet or a Tailwind class change unintentionally overrides an existing rule elsewhere in the app.
- Third-party script/style pollution — an analytics or chat-widget script injects global CSS that breaks unrelated components.
- Font loading failures — a webfont fails to load (CDN issue, CORS issue, subsetting bug) and the fallback font reflows the entire layout.
- Responsive breakpoint regressions — a component looks fine at 1920px and completely collapses at 768px because a media query was edited incorrectly.
- Z-index and stacking context bugs — a modal or dropdown silently renders behind another element.
- Design system drift — spacing, color, or typography tokens get overridden locally instead of through the design system, and nobody notices until the UI has quietly diverged from Figma.
- RTL/i18n layout breaks — text expansion in German or French, or right-to-left layout in Arabic/Hebrew, breaks a fixed-width container.
None of these produce a functional test failure. The button still exists, is still clickable, and still fires the right event. It’s just visually broken — and Playwright visual regression testing is the only automated technique that catches this class of bug before a human does.
Why Playwright for Visual Regression Testing
Before Playwright had first-class visual comparison support, most teams reached for dedicated SaaS platforms — Percy, Chromatic, Applitools — bolted onto whatever E2E framework they were already using. That’s still a completely valid choice for certain teams (I cover the tradeoffs later in this guide), but Playwright’s native visual testing capability, built around expect(page).toHaveScreenshot() and expect(locator).toHaveScreenshot(), has matured to the point where a large percentage of teams don’t need a third-party service at all.
Here’s why Playwright specifically is a strong foundation for Playwright visual regression testing:
1. Deterministic Rendering via Bundled Browsers
Playwright ships its own bundled builds of Chromium, Firefox, and WebKit rather than relying on whatever browser version happens to be installed on a machine. This is the single biggest factor in reducing visual test flakiness. If your baseline was captured with Chromium 124 and your CI runs Chromium 131 six months later without you updating Playwright, you will see systemic, low-level rendering drift across your entire suite — font hinting changes, sub-pixel anti-aliasing differences, scrollbar rendering. Playwright pins the exact browser build version to the Playwright package version, so as long as your baselines and your CI runner use the same Playwright version, rendering is deterministic.
2. Auto-Waiting Eliminates a Whole Class of Flakiness
Playwright’s actionability checks and auto-waiting mean that by the time you call a screenshot assertion, Playwright has already waited for the element to be visible, stable (not animating), and not obscured. This removes an enormous source of flaky screenshots that plagued older screenshot-testing setups built on Selenium, where you had to manually sprinkle sleeps before every capture.
3. Native, Zero-Extra-Dependency API
You don’t need to install a separate library, sign up for a SaaS account, or configure an external diffing service. toHaveScreenshot() ships in @playwright/test itself. For a team that already has Playwright in their stack for functional E2E testing, visual regression is close to a one-line addition.
4. Cross-Browser and Cross-Device Emulation Built In
Playwright’s device emulation (viewport size, device scale factor, user agent, touch support) means you can generate visual baselines across a real matrix of browsers and viewport sizes using the same test code, just parameterized by project configuration.
5. Git-Friendly Baseline Storage
Baselines are stored as PNG files directly in your repository (or wherever you choose to store them), which means they’re versioned alongside the code that produces them. When you check out an old commit, you get the exact baselines that were valid for that commit. This is architecturally different from SaaS visual testing tools where baselines live in an external dashboard, decoupled from your git history.
Where Playwright’s Native VRT Falls Short
In fairness, native Playwright visual testing isn’t a strict superset of what dedicated platforms offer. It lacks: a web-based review UI for non-technical stakeholders to approve visual changes, cross-browser rendering farms that eliminate OS-level font rendering differences entirely, AI-based “smart” diffing that ignores anti-aliasing noise more aggressively, and built-in dashboards showing visual diff trends over time. I’ll return to this comparison in detail later in the guide, because the right answer genuinely depends on team size, budget, and how many stakeholders outside engineering need to review visual changes.
Setting Up Playwright for Visual Regression Testing
If you already have a Playwright project, visual testing needs no new dependencies. If you’re starting from scratch, here’s a clean setup.
Installation
npm init playwright@latest
This scaffolds a playwright.config.ts, an example test, and installs browser binaries. If you’re adding visual testing to an existing project, make sure your Playwright version is current, since screenshot rendering behavior has changed across major versions and you want baseline consistency:
npm install -D @playwright/test@latest
npx playwright install --with-deps
The --with-deps flag also installs OS-level dependencies the browsers need (font libraries, codecs) which matters enormously for visual testing consistency — missing system fonts are one of the most common causes of “why does my CI screenshot look different from my local screenshot” bugs.
Baseline Project Structure
A typical structure for a visual-testing-heavy Playwright project looks like this:
tests/
  visual/
    homepage.visual.spec.ts
    checkout.visual.spec.ts
    components/
      button.visual.spec.ts
      modal.visual.spec.ts
  visual.spec.ts-snapshots/
    homepage.visual.spec.ts-snapshots/
      homepage-chromium-linux.png
      homepage-firefox-linux.png
playwright.config.ts
Playwright automatically creates the -snapshots directory alongside your test file, with subdirectories that encode the browser project and platform in the filename. This matters: a baseline captured on macOS will not match a screenshot taken on Linux, because font rendering differs at the OS level. This is precisely why running visual tests inside Docker (covered in detail later) is close to mandatory for any team with more than one contributor.
Minimal Config for Visual Testing
import { defineConfig, devices } from '@playwright/test';

export default defineConfig({
  testDir: './tests',
  expect: {
    toHaveScreenshot: {
      maxDiffPixelRatio: 0.01,
      animations: 'disabled',
      caret: 'hide',
    },
  },
  projects: [
    {
      name: 'chromium',
      use: { ...devices['Desktop Chrome'] },
    },
  ],
});
I’ll unpack every one of these options — and several more you should know about — in the configuration section below, because the defaults are not what most teams should actually ship with in CI.
Your First Visual Test: toHaveScreenshot() in Practice
The core API for Playwright visual regression testing is expect(page).toHaveScreenshot() for full-page or viewport captures, and expect(locator).toHaveScreenshot() for a specific element. Let’s start with the simplest possible example:
import { test, expect } from '@playwright/test';

test('homepage matches visual baseline', async ({ page }) => {
  await page.goto('https://example.com');
  await expect(page).toHaveScreenshot('homepage.png');
});
The first time you run this test, there is no baseline yet, so Playwright will generate one and the test will fail with a message telling you a new baseline was written. This is expected behavior, not a bug — you need to explicitly tell Playwright “yes, this is the correct baseline” by running with the update flag:
npx playwright test --update-snapshots
This writes the PNG into the -snapshots folder next to your test file. Commit that PNG to git. From this point forward, every test run compares against that committed baseline.
Element-Level Screenshots
Full-page screenshots are useful for catching broad layout regressions, but they’re a blunt instrument. A single unrelated pixel shift anywhere on the page fails the whole test, and full-page screenshots are more prone to flakiness from things like ads, timestamps, or animated backgrounds. In most mature suites, the majority of visual assertions target specific components:
test('pricing card renders correctly', async ({ page }) => {
  await page.goto('/pricing');
  const card = page.getByTestId('pricing-card-pro');
  await expect(card).toHaveScreenshot('pricing-card-pro.png');
});
Element-level screenshots are faster to review (smaller diff images), less prone to unrelated noise, and map naturally onto a component-driven frontend architecture — one visual test per component variant, similar to how you’d structure Storybook stories.
Naming Snapshots Explicitly
If you don’t pass a name argument, Playwright derives the snapshot filename from the test name and a counter. I strongly recommend always passing an explicit name — toHaveScreenshot('checkout-empty-cart.png') rather than the auto-generated checkout-1.png — because explicit names survive test renames and are far easier to locate in a large snapshot directory during a diff review.
Running and Reading the Results
When a visual test fails, Playwright’s HTML report shows a three-way comparison: the expected (baseline) image, the actual (new) image, and a diff image with the changed pixels highlighted, typically in a contrasting color. You can generate this report locally with:
npx playwright test --reporter=html
npx playwright show-report
This diff view is the single most useful artifact in the entire workflow — it’s what a reviewer looks at to decide “this is an intentional design change, update the baseline” versus “this is a regression, block the PR.”
Configuration Deep Dive: Every Option That Actually Matters
The default configuration for toHaveScreenshot() is tuned to be conservative, which in practice means too strict for most real applications. Understanding each option is the difference between a visual test suite that’s a reliable safety net and one that’s an ignored, permanently-red nuisance that your team eventually disables.
maxDiffPixelRatio and maxDiffPixels
These two options control how much pixel difference is tolerated before a test fails.
maxDiffPixelRatio— the maximum allowed ratio of differing pixels to total pixels, expressed as a decimal (e.g.,0.01= 1% of pixels can differ).maxDiffPixels— an absolute pixel count instead of a ratio.
I default to maxDiffPixelRatio: 0.01 to 0.02 for most component-level tests. Full-page tests, which have far more surface area for meaningless noise (font sub-pixel rendering, scrollbar presence/absence), often need a slightly higher tolerance, sometimes 0.03. Set this too low (like the library default of near-zero) and you’ll get failures from rendering noise that has nothing to do with an actual regression. Set it too high and you stop catching real bugs — a misaligned button might only shift 0.5% of the page’s pixels.
threshold
This is a separate, per-pixel setting — not to be confused with the diff ratio above. threshold (0 to 1, default 0.2) controls how different two individual pixels’ colors need to be before pixelmatch counts them as “different” at all. It operates on the YIQ perceptual color distance I described earlier. Raising this value (e.g., to 0.3) makes the comparison more forgiving of minor color/anti-aliasing variance per pixel; lowering it makes even subtle color shifts count as a difference.
await expect(page).toHaveScreenshot('dashboard.png', {
  maxDiffPixelRatio: 0.02,
  threshold: 0.25,
});
animations: ‘disabled’
This is, in my experience, the single highest-value setting in the entire API, and it should be a global default in your config rather than something you set per-test. When set to 'disabled', Playwright finds all CSS animations and transitions on the page and effectively freezes them — animations are set to their finished state and transitions are disabled — before capturing the screenshot. Without this, any test on a page with a fade-in, a loading spinner, a carousel, or a hover transition will be flaky, because the exact frame captured depends on precise timing that varies run to run.
caret: ‘hide’
Hides the text input caret before capturing. Without this, any screenshot of a focused text input has a 50% chance of capturing the blinking caret in either its visible or invisible blink state, which is a classic source of “flaky” visual tests that flip pass/fail with no code changes at all.
scale: ‘css’ vs ‘device’
Controls whether the screenshot is taken at CSS pixel resolution or physical device pixel resolution (accounting for device pixel ratio / Retina displays). 'css' is the safer default for cross-machine consistency, since 'device' will produce a 2x or 3x larger image on high-DPI capture environments, which then fails to match a baseline generated on a standard-DPI CI runner.
mask
Accepts an array of locators whose bounding boxes get covered with a solid color (pink, by default) before comparison. This is how you handle genuinely dynamic content — timestamps, ad slots, randomly generated avatars, live chat widgets — without excluding them from the screenshot entirely:
await expect(page).toHaveScreenshot('dashboard.png', {
  mask: [page.getByTestId('last-updated-timestamp'), page.locator('.ad-slot')],
});
I cover masking strategy in much more depth in the dynamic content section below, because getting this wrong is the number one cause of visual test suites that teams eventually abandon.
fullPage
When true, captures the entire scrollable page rather than just the current viewport. Useful for full-page regression checks, but be aware it increases the chance of catching unrelated noise further down the page, and it can behave inconsistently with lazy-loaded content that only renders once scrolled into view — Playwright does auto-scroll to trigger lazy loading before capturing, but timing-sensitive lazy loaders can still cause flakiness.
clip
Captures a specific rectangular region of the page by pixel coordinates, regardless of DOM structure. Rarely the right tool compared to element-level locators, but occasionally useful for capturing a region that spans multiple unrelated elements.
stylePath / A Custom CSS Injection
You can pass a stylePath pointing to a CSS file that gets injected before the screenshot is taken. Teams use this to hide elements that are impossible to reliably mask by locator (e.g., third-party iframes that inject content asynchronously), forcing visibility: hidden on known-noisy selectors globally.
Recommended Global Defaults
export default defineConfig({
  expect: {
    toHaveScreenshot: {
      maxDiffPixelRatio: 0.02,
      threshold: 0.25,
      animations: 'disabled',
      caret: 'hide',
      scale: 'css',
    },
  },
});
Start here, then loosen or tighten per-test as you learn where your genuine noise sources are. Do not leave the library defaults untouched and assume the suite will be stable — it won’t.
Full Page vs. Element vs. Clip Screenshots: Choosing the Right Granularity
One of the most consequential architectural decisions in a visual regression suite is deciding at what granularity you capture screenshots. Get this wrong and you either drown in noisy false failures or fail to catch real regressions. There’s no single right answer — mature suites use all three approaches for different purposes.
Full-Page Screenshots
Best for: catching unexpected structural regressions across an entire page, particularly on pages that don’t change often (marketing pages, legal pages, static documentation).
Weaknesses: a single failure anywhere on the page fails the whole test and produces a large diff image that’s tedious to review. Also more exposed to any dynamic content anywhere on the page — a single un-masked timestamp buried in a footer will make every full-page test flaky.
Element-Level Screenshots
Best for: the majority of your suite. Component-driven visual testing — cards, modals, buttons, form fields, navigation bars — captured in isolation. This is the closest visual testing analog to unit testing: small, focused, fast to review, and precisely attributable when it fails.
Weaknesses: won’t catch cross-component layout issues, like two correctly-rendered components that happen to overlap each other due to a z-index or positioning bug elsewhere in the layout.
Clip-Based Screenshots
Best for: capturing a specific pixel region that spans multiple elements or doesn’t map cleanly onto a single DOM node — for example, a fixed-position header plus the top of the content area, to check for overlap.
Weaknesses: brittle to any layout shift above the clipped region, since it’s coordinate-based rather than DOM-relative.
A Practical Rule of Thumb
I structure most production suites roughly like this: 70% element-level component tests, 20% full-page tests on critical, relatively static pages (homepage, pricing, checkout summary), and 10% clip-based tests for specific layout-interaction edge cases. This ratio keeps the suite fast, keeps diff reviews small and legible, and still catches page-level composition bugs on the pages that matter most.
Handling Dynamic Content: The Make-or-Break Skill
If there’s one skill that separates a visual regression suite that survives six months from one that gets disabled after two weeks, it’s handling dynamic content correctly. Every real application has content that legitimately changes between runs — and if you don’t account for it, your suite will fail constantly for reasons that have nothing to do with actual UI regressions, and your team will stop trusting it within days.
Common Sources of Dynamic Content
- Timestamps and relative dates (“2 minutes ago”)
- User-generated or randomly-seeded avatars and profile images
- Live counters (view counts, stock levels, notification badges)
- Ads and third-party embedded widgets
- Carousels and auto-rotating banners
- Animated loading states and skeleton screens
- Randomized A/B test variants
- Live chat widgets that render asynchronously
- CSRF tokens or session-specific IDs rendered in the DOM (rare, but happens)
Strategy 1: Masking
The mask option, shown earlier, is the right tool when the dynamic element’s presence and position are stable and predictable, but its content varies. Masking paints over the region so the pixel diff simply ignores it entirely:
await expect(page).toHaveScreenshot('order-confirmation.png', {
  mask: [
    page.getByTestId('order-timestamp'),
    page.getByTestId('order-id'),
  ],
  maskColor: '#FF00FF',
});
Use masking generously for content that’s genuinely non-deterministic but whose layout footprint is fixed. It’s cheap and reliable.
Strategy 2: Mocking Data at the Network Layer
A better strategy than masking, wherever feasible, is to eliminate the non-determinism entirely by intercepting network requests and returning fixed, deterministic fixture data. Playwright’s page.route() makes this straightforward:
await page.route('**/api/dashboard/stats', route =>
  route.fulfill({
    status: 200,
    contentType: 'application/json',
    body: JSON.stringify({ activeUsers: 4213, revenue: 128500 }),
  })
);
await page.goto('/dashboard');
await expect(page).toHaveScreenshot('dashboard.png');
This is strictly better than masking wherever it’s practical, because it lets you actually verify the content is correct, not merely that it’s present — masking a number means you can never catch a bug where that number renders with the wrong formatting or currency symbol. Reserve masking for content you genuinely can’t or don’t want to control (third-party ad slots, embedded widgets).
Strategy 3: Freezing Time
For any timestamp-driven UI, freeze the clock rather than masking the timestamp, whenever you want to assert the exact rendered text is correct. Playwright supports clock control natively:
await page.clock.setFixedTime(new Date('2026-01-15T10:00:00'));
await page.goto('/dashboard');
await expect(page).toHaveScreenshot('dashboard-jan15.png');
Strategy 4: Disabling Animations and Carousels
Beyond the global animations: 'disabled' config option (which handles CSS transitions/animations), auto-rotating carousels driven by JavaScript timers need to be paused explicitly, usually by injecting a script or exposing a test-only flag that disables the rotation interval in non-production builds.
Strategy 5: Waiting for Genuine Stability, Not Arbitrary Timeouts
Resist the temptation to add page.waitForTimeout(2000) before a screenshot “just to be safe.” It’s a common anti-pattern that makes tests slower without actually making them more reliable — a fixed delay is either too short (flaky) or unnecessarily long (slow) for any given machine’s actual load and rendering speed. Prefer explicit signals: wait for a specific element to be visible, wait for a loading spinner to detach from the DOM, or wait for a network idle state scoped to the specific request that matters, rather than a global networkidle wait (which is discouraged by the Playwright team themselves for general use, since it can wait indefinitely on pages with long-polling or analytics beacons).
Cross-Browser and Cross-Platform Rendering Challenges
This is the section that trips up almost every team new to Playwright visual regression testing, and it deserves to be understood at a mechanical level rather than treated as mysterious flakiness.
Why Baselines Don’t Transfer Across Operating Systems
Font rendering is not standardized across operating systems. Even with the exact same font file, exact same font size, and exact same browser engine, macOS, Windows, and Linux use different font rasterization and anti-aliasing algorithms at the OS level (Core Text on macOS, DirectWrite on Windows, FreeType on Linux). This means a screenshot of literally the same HTML/CSS, captured on a Mac versus captured inside a Linux Docker container in CI, will not pixel-match — not because anything is wrong, but because the two operating systems draw text differently at the sub-pixel level.
This is why Playwright names snapshot files with the platform baked in (e.g., homepage-chromium-linux.png) — it’s explicitly designed around the assumption that baselines are platform-specific.
The Practical Consequence: Generate Baselines Where You Run Tests
The single most important operational rule for cross-platform visual testing sanity: your baselines must be generated in the same environment where your tests will run in CI. If your CI runs Playwright inside a specific Docker image, generate and update your baselines inside that exact same Docker image — not on a developer’s MacBook. I cover the exact Docker workflow in the next section.
Cross-Browser Differences (Chromium vs. Firefox vs. WebKit)
Beyond OS-level font rendering, the browser engines themselves render certain CSS features slightly differently — scrollbar styling, form control default styling (checkboxes, radio buttons, select dropdowns), and subtle differences in how box-shadow or border-radius anti-aliasing is rendered. This means you maintain separate baseline sets per browser project, which Playwright does automatically as long as your projects config is set up with distinct browser projects. Don’t try to force a single baseline to match across Chromium, Firefox, and WebKit — accept that each browser project gets its own baseline set, and scope your visual test matrix intentionally rather than running every visual test against every browser by default (which multiplies your maintenance burden for often-marginal additional coverage).
My general recommendation: run your full visual regression suite against Chromium only in most CI runs (it’s the most common user browser and the most deterministic to render), and run a smaller, high-value subset against Firefox and WebKit on a slower cadence — nightly or pre-release — rather than on every PR.
Device Pixel Ratio and Retina Displays
If any of your baselines were accidentally generated on a high-DPI (Retina) machine with scale: 'device', they’ll be roughly 2x the pixel dimensions of a baseline generated on a standard-DPI CI runner, causing an immediate and total dimension mismatch failure. Standardize on scale: 'css' in your config (shown earlier) to sidestep this entirely, and explicitly set deviceScaleFactor: 1 in your Playwright project config for consistency.
Running Visual Tests in Docker for Deterministic Rendering
Given everything above, running visual regression tests inside a pinned, consistent Docker image is close to a hard requirement for any team beyond a single contributor. Microsoft publishes official Playwright Docker images tagged to exact Playwright versions, which is the cleanest way to guarantee your local baseline generation and your CI test execution use bit-for-bit identical browser binaries and OS-level rendering libraries.
docker run --rm -v $(pwd):/work -w /work \
  mcr.microsoft.com/playwright:v1.49.0-noble \
  npx playwright test --update-snapshots
Note the exact version tag in the image name (v1.49.0-noble) — this must match the @playwright/test version in your package.json. A mismatch between the Docker image’s bundled browser version and your npm package’s expected browser version is one of the most common causes of “my baselines don’t match in CI” bug reports, and it’s entirely avoidable by keeping these two pinned together and bumping them in lockstep.
A Practical Local Workflow
Here’s the workflow I use and recommend to teams: developers write and iterate on visual tests locally against their native OS (fast feedback loop, no Docker overhead for day-to-day development). But the moment a baseline needs to be created or updated — a genuine, intentional UI change — that update is generated inside the same Docker image CI uses, not on the developer’s own machine:
# package.json script
"visual:update": "docker run --rm -v $(pwd):/work -w /work mcr.microsoft.com/playwright:v1.49.0-noble npx playwright test --update-snapshots"
This keeps local development fast while guaranteeing that every committed baseline was generated in the exact rendering environment CI will compare against.
CI/CD Integration: Wiring Visual Tests Into GitHub Actions
A visual regression suite that only runs locally provides almost none of its potential value. The entire point is to catch regressions automatically on every pull request, before a human reviewer or QA engineer has to notice a broken layout manually. Here’s a complete, production-realistic GitHub Actions workflow.
name: Visual Regression Tests

on:
  pull_request:
    branches: [main]

jobs:
  visual-tests:
    runs-on: ubuntu-latest
    container:
      image: mcr.microsoft.com/playwright:v1.49.0-noble
    steps:
      - uses: actions/checkout@v4

      - name: Install dependencies
        run: npm ci

      - name: Run visual regression tests
        run: npx playwright test tests/visual --reporter=html

      - name: Upload HTML report
        if: failure()
        uses: actions/upload-artifact@v4
        with:
          name: playwright-visual-report
          path: playwright-report/
          retention-days: 14

      - name: Upload diff images
        if: failure()
        uses: actions/upload-artifact@v4
        with:
          name: visual-diffs
          path: test-results/**/*-actual.png
          retention-days: 14
A few decisions in this workflow are worth explaining, because they’re easy to get wrong:
Using the Container Image, Not Just Installing Playwright
Running the job inside container: image: mcr.microsoft.com/playwright:... rather than just running npx playwright install on a standard ubuntu-latest runner ensures you’re using the exact same OS-level font rendering stack as your local Docker baseline generation. This is the detail that most tutorials skip and most teams get bitten by.
Uploading Artifacts on Failure
The HTML report and the raw diff images need to be uploaded as CI artifacts specifically if: failure(), because that’s the only way a reviewer can actually see what changed without pulling the branch and running tests locally. Without this step, a failed visual test just shows a red X with no visual context, which defeats the entire purpose.
Baseline Update Workflow for Legitimate Changes
When a visual test fails because of an intentional design change (not a regression), the developer needs an easy path to accept the new baseline. A common pattern is a PR comment-triggered workflow or a manually-dispatched workflow that regenerates and commits new baselines:
name: Update Visual Baselines

on:
  workflow_dispatch:
    inputs:
      branch:
        description: 'Branch to update baselines on'
        required: true

jobs:
  update-baselines:
    runs-on: ubuntu-latest
    container:
      image: mcr.microsoft.com/playwright:v1.49.0-noble
    steps:
      - uses: actions/checkout@v4
        with:
          ref: ${{ github.event.inputs.branch }}
      - run: npm ci
      - run: npx playwright test tests/visual --update-snapshots
      - name: Commit updated baselines
        run: |
          git config user.name "playwright-bot"
          git config user.email "bot@qatribe.in"
          git add tests/visual/**/*-snapshots
          git commit -m "chore: update visual regression baselines" || echo "No changes"
          git push
This gives developers a self-service way to accept intentional visual changes without a human manually copying PNG files around, while still requiring an explicit, auditable action (a workflow dispatch) rather than baselines silently auto-updating on every run — which would defeat the entire purpose of the safety net.
Sharding for Speed on Large Suites
Once a visual suite grows past a few hundred assertions, sequential execution in CI becomes a bottleneck. Playwright’s built-in sharding splits the suite across parallel CI jobs:
strategy:
  matrix:
    shard: [1, 2, 3, 4]
steps:
  - run: npx playwright test tests/visual --shard=${{ matrix.shard }}/4
Combined with GitHub Actions’ matrix strategy, this turns a 20-minute sequential visual suite into a roughly 5-minute parallel one, assuming reasonably balanced test distribution across shards.
Baseline Management Strategies at Scale
As a visual regression suite grows from a handful of tests to hundreds or thousands, baseline management stops being an afterthought and becomes an explicit process your team needs to agree on. Here’s what I’ve found works.
Where Baselines Live
For most teams, committing baseline PNGs directly to the repository (Playwright’s default behavior) is the right call — it keeps baselines versioned alongside the code, visible in diffs, and available offline. The downside is repository bloat: PNG files, even optimized, add up. For very large suites (thousands of baselines, especially across multiple browser projects), some teams move baselines to Git LFS, or to external storage (S3, a dedicated artifact registry) with a manifest file tracking version-to-baseline mappings. I’d only recommend that complexity once your .git directory size from snapshots becomes a genuine problem — for most teams, plain committed PNGs are simpler and entirely sufficient.
The Review and Approval Workflow
Every visual test failure needs a clear path to one of two outcomes: “this is a regression, fix the code” or “this is an intentional change, update the baseline.” The failure mode I’ve seen kill visual regression adoption most often is a missing or unclear approval workflow — a test fails, nobody’s sure if it’s expected, someone updates the baseline “to make it pass” without actually verifying the change, and from that point on the suite is rubber-stamping whatever ships rather than catching anything.
Concrete practices that prevent this:
- Require the diff image to be explicitly reviewed and linked or commented on the PR before a baseline update is merged — treat it like a code review, not a build fix.
- Never allow
--update-snapshotsto run automatically as part of a normal CI pipeline; it should only run via an explicit, intentional action (manual dispatch, or a specific opt-in label on a PR). - For design-driven changes, involve whoever owns the visual design (a designer, or a lead who reviews against Figma) in the approval, not just the engineer who wrote the code.
Baseline Drift and Periodic Audits
Over months, some baselines become stale — a component gets deleted but its baseline lingers, or a test gets skipped and its baseline is never updated. I recommend a quarterly audit: run a script that flags baseline files with no corresponding active test, and flag tests that have been skipped or failing-and-ignored for more than a sprint. This is a small maintenance cost that prevents baseline directories from silently accumulating dead weight.
Responsive and Viewport Testing
Layout bugs are disproportionately common at specific breakpoints, and a visual suite that only ever tests at one viewport size (usually whatever the developer’s laptop happened to be running) misses an enormous category of real-world bugs. Playwright makes multi-viewport visual testing straightforward via project configuration:
export default defineConfig({
  projects: [
    {
      name: 'chromium-desktop',
      use: { ...devices['Desktop Chrome'], viewport: { width: 1440, height: 900 } },
    },
    {
      name: 'chromium-tablet',
      use: { ...devices['iPad (gen 7)'] },
    },
    {
      name: 'chromium-mobile',
      use: { ...devices['iPhone 13'] },
    },
  ],
});
Running the same test file across all three projects generates three separate baseline sets automatically (Playwright includes the project name in the snapshot filename), giving you responsive coverage without duplicating test code.
Prioritizing Which Breakpoints Matter
Testing every possible viewport width is neither practical nor valuable. Instead, anchor your viewport matrix to your actual CSS breakpoints — if your design system defines breakpoints at 640px, 768px, 1024px, and 1440px, test just inside and just outside each of those boundaries, since that’s precisely where layout bugs cluster (an element that looks correct at 1025px but breaks at 1023px because a media query boundary is off by one).
Component-Level Visual Testing and Storybook Integration
For teams using a component library or design system, pairing Playwright visual testing with Storybook (or a similar component catalog) gives you visual regression coverage of every component variant and state, independent of any full application page. Playwright can navigate directly to a Storybook iframe URL for a specific story:
test('button - primary - hover state', async ({ page }) => {
  await page.goto('http://localhost:6006/iframe.html?id=button--primary');
  await page.getByRole('button').hover();
  await expect(page).toHaveScreenshot('button-primary-hover.png');
});
This pattern scales well because it decouples visual coverage from application routing — you can visually test a component in isolation, across every prop combination and interaction state (default, hover, focus, disabled, error), without needing to navigate through the full application to reach that state.
Dark Mode and Theme Visual Testing
Applications with light/dark themes (or multiple brand themes for white-labeled products) need visual coverage for every theme, since theme-specific bugs — a text color that becomes invisible against a dark background, a border that disappears, an icon that isn’t theme-aware — are common and easy to miss in manual QA if the reviewer only checks the default theme.
test.describe('dashboard - theme coverage', () => {
  for (const theme of ['light', 'dark'] as const) {
    test(`dashboard renders correctly in ${theme} mode`, async ({ page }) => {
      await page.goto('/dashboard');
      await page.evaluate((t) => {
        document.documentElement.setAttribute('data-theme', t);
      }, theme);
      await expect(page).toHaveScreenshot(`dashboard-${theme}.png`);
    });
  }
});
Setting the theme via page.evaluate to directly toggle a data-theme attribute (or whatever mechanism your app uses) is more reliable than clicking a UI toggle, since it removes a transition animation and a network round-trip from the critical path of the test, reducing flakiness. If your app also respects the OS-level prefers-color-scheme media query, Playwright can emulate that directly:
test.use({ colorScheme: 'dark' });Playwright vs. Percy vs. Chromatic vs. Applitools: Choosing the Right Tool
This is the question I get asked most often when teams are deciding on a visual testing strategy, and the honest answer is “it depends on your team size, budget, and who needs to review visual changes” — not “Playwright is always right” or “always use a SaaS tool.” Here’s an honest breakdown based on what each is actually good at.
Playwright Native (toHaveScreenshot)
Strengths: free, no external dependency, baselines versioned in git alongside code, tightly integrated with your existing E2E suite, full control over diffing configuration.
Weaknesses: no web-based review dashboard for non-engineers, cross-browser/cross-OS rendering differences are entirely your problem to manage (via Docker), no built-in visual diff trend analytics, baseline approval is a manual git-based process.
Best for: engineering-driven teams where PR review already happens in GitHub/GitLab, teams that want zero additional spend, teams comfortable owning their CI infrastructure.
Percy (by BrowserStack)
Strengths: renders screenshots across many real browser/OS combinations on Percy’s own infrastructure (removing your local rendering-consistency problem entirely), has a polished web review UI built specifically for visual diff approval, integrates with Playwright, Cypress, Selenium, and Storybook.
Weaknesses: paid SaaS with per-screenshot pricing that scales with suite size, baselines live outside your git history, adds an external network dependency to your CI pipeline.
Best for: teams that need non-engineering stakeholders (designers, PMs) to review and approve visual changes in a UI, and teams that don’t want to own cross-browser rendering infrastructure themselves.
Chromatic (by the Storybook team)
Strengths: purpose-built for Storybook-based component visual testing, extremely tight integration if you’re already using Storybook, strong UI review flow with per-PR visual change summaries.
Weaknesses: primarily oriented around component-level (Storybook) testing rather than full-page/application-flow testing, paid tiers scale with snapshot volume.
Best for: component-library-first teams already invested in Storybook as their source of truth for UI components.
Applitools
Strengths: Applitools’ “Ultrafast Grid” and AI-based “Visual AI” diffing engine are genuinely more sophisticated than pixel-diffing — it’s better at distinguishing meaningful layout regressions from meaningless anti-aliasing noise, reducing false positives significantly at scale. Broad cross-browser/cross-device rendering grid.
Weaknesses: the most expensive option in this category, adds real complexity and a learning curve, arguably overkill for small-to-mid-size suites.
Best for: large enterprises with very large visual test suites (thousands of checks) where false-positive noise from pixel-diffing becomes a genuine productivity problem, and where the cost is justified by suite scale.
My Practical Recommendation
Start with Playwright’s native visual testing. It’s free, it’s already available if you’re using Playwright for E2E, and for the large majority of teams — even teams with a few hundred visual checks — it’s entirely sufficient once you’ve got masking, Docker-based baseline generation, and a disciplined review workflow in place. Move to a paid platform like Percy or Applitools specifically when you hit a concrete pain point native Playwright can’t solve: non-engineering stakeholders need a review UI, you need broader real-device/browser coverage than you can practically self-host, or false-positive noise at scale is genuinely costing more engineering time than the tool would cost in subscription fees. Don’t adopt a paid platform preemptively “just in case” — that’s an easy way to pay for infrastructure your team doesn’t actually need yet.
Diagnosing and Fixing Flaky Visual Tests
Flakiness is what kills visual regression suites in practice. A functional test that’s flaky 2% of the time is annoying. A visual test suite that’s flaky 2% of the time, run across hundreds of screenshots on every PR, means someone is re-running CI multiple times per day “just because,” and within a month the whole team has learned to ignore red visual test results by default — which is worse than not having the suite at all, because it creates false confidence.
A Systematic Debugging Approach
When a visual test flakes, resist the urge to just bump the diff tolerance and move on — that’s treating the symptom and it erodes your suite’s actual sensitivity over time. Instead, work through this checklist:
- Is
animations: 'disabled'set? This alone resolves the majority of flakiness I encounter in practice. Verify it’s actually applying — some custom CSS animations driven by JavaScript rather than CSS transitions aren’t caught by this setting and need manual handling. - Is there unmasked dynamic content? Check the diff image carefully — flaky failures often show a tiny, easy-to-miss diff region (a timestamp, a randomly generated ID, an ad slot) rather than an obvious large change.
- Is the test waiting for genuine visual stability, or just DOM presence? An element being present in the DOM doesn’t mean it’s finished rendering — web fonts can still be loading (use
document.fonts.readyas an explicit wait condition), images can still be loading, or a layout-shifting async component can still be resolving. - Is the baseline environment-matched? Confirm the baseline was generated in the same Docker image / Playwright version as the CI runner executing the comparison.
- Is there a race condition with lazy-loaded content on full-page screenshots? Playwright auto-scrolls to trigger lazy loading before a full-page capture, but very slow-loading images can still be mid-load when the capture fires. Consider explicit waits for specific image
naturalWidthto be non-zero, or switch to element-level screenshots that don’t require full-page scrolling. - Is GPU rendering non-determinism involved? In rare cases, particularly with complex CSS (gradients, filters, box-shadows with blur), sub-pixel rendering can vary slightly between runs even on identical hardware. A small
maxDiffPixelRatiotolerance (rather than zero) absorbs this without masking real regressions.
Waiting for Fonts Explicitly
Web font loading is an underrated source of visual flakiness, especially on the first test run after a cold cache. Wait for the Font Loading API to confirm fonts are ready before capturing:
await page.goto('/dashboard');
await page.evaluate(() => document.fonts.ready);
await expect(page).toHaveScreenshot('dashboard.png');
Retries as a Last Resort, Not a Fix
Playwright supports automatic retries at the test-runner level, and it’s tempting to set retries: 2 globally to paper over occasional flakiness. Use this sparingly and treat every retry-triggered pass as a signal to investigate, not as the suite “working correctly.” A visual test that only passes on the second attempt is telling you something real about non-determinism in your rendering pipeline — retries hide the symptom without addressing the cause.
Visual Testing and Accessibility: An Underused Overlap
Visual regression testing and accessibility testing are usually treated as entirely separate disciplines, but there’s meaningful overlap worth exploiting. Since you already have Playwright driving a real browser to capture screenshots, it’s a small additional step to also run accessibility checks (via @axe-core/playwright) at the same point in the same test, catching both visual and a11y regressions from a single test run:
import AxeBuilder from '@axe-core/playwright';

test('pricing page - visual and accessibility', async ({ page }) => {
  await page.goto('/pricing');
  await expect(page).toHaveScreenshot('pricing.png');

  const results = await new AxeBuilder({ page }).analyze();
  expect(results.violations).toEqual([]);
});
Beyond automated axe checks, visual regression baselines are also useful for manually verifying color contrast changes over time — if a design system update shifts a text color, the visual diff makes that shift immediately visible to a reviewer even before an automated contrast checker flags a WCAG violation.
Best Practices and Anti-Patterns
Best Practices
- Scope visual tests to stable, high-value UI. Not every page needs a visual test. Prioritize pages and components with high user traffic, high business value (checkout, pricing, signup), or a history of visual regressions.
- Prefer element-level over full-page screenshots by default. Reserve full-page for a small set of critical, relatively static pages.
- Mock dynamic data at the network layer wherever practical, mask only what you can’t control.
- Generate and update baselines inside the same Docker image CI uses. Never generate a baseline on a developer’s native OS and expect it to match Linux-based CI.
- Set
animations: 'disabled'andcaret: 'hide'globally. These are close to zero-downside defaults. - Require explicit, reviewed baseline updates. Never let
--update-snapshotsrun automatically as part of a standard CI pipeline. - Name snapshots explicitly and descriptively.
checkout-empty-cart-mobile.png, notcheckout-1.png. - Pin your Playwright version and Docker image version together, and bump them deliberately in a single PR, re-generating all baselines in that same PR.
- Audit and prune stale baselines periodically. Dead baselines for deleted components are wasted repo weight and reviewer confusion.
Anti-Patterns to Avoid
- Testing every page at full resolution “for completeness.” This produces a slow, noisy suite that nobody trusts and everybody eventually skips reviewing carefully.
- Adding arbitrary
waitForTimeout()calls to “fix” flakiness. This treats a symptom, not the cause, and makes the suite slower without making it reliably correct. - Setting
maxDiffPixelRatioto zero. Guarantees noise-driven false failures from anti-aliasing and font-rendering non-determinism; you’ll end up training your team to ignore failures. - Generating baselines on whatever OS a developer happens to be using. Guarantees a CI/local mismatch the first time someone runs the suite from a different machine.
- Auto-approving baseline updates without visual review. Turns the suite from “regression detector” into “screenshot recorder that always passes,” providing false confidence.
- Running the entire visual suite against every browser on every PR by default. Multiplies maintenance cost for often-marginal coverage gain; scope your cross-browser matrix intentionally.
- Ignoring flaky tests instead of fixing them. A visual test that flakes and gets silently re-run until green trains your team to distrust every result, including real regressions.
Real-World Walkthrough: Building a Visual Regression Suite for an E-Commerce Checkout Flow
To ground everything above in a concrete example, here’s how I’d structure visual regression coverage for a typical e-commerce checkout flow — a high-value, high-risk area where a silent layout break directly costs revenue.
Step 1: Identify the Critical States
Rather than trying to visually test “the checkout page” as one monolithic thing, break it into the distinct states a real user encounters: empty cart, cart with one item, cart with multiple items and a discount applied, the shipping form (empty and with validation errors), the payment form, and the order confirmation screen.
Step 2: Mock the Backend for Determinism
test.beforeEach(async ({ page }) => {
  await page.route('**/api/cart', route =>
    route.fulfill({
      status: 200,
      body: JSON.stringify({
        items: [{ id: 'sku-123', name: 'Wireless Mouse', price: 29.99, qty: 1 }],
        subtotal: 29.99,
        discount: 0,
      }),
    })
  );
});
Step 3: Write Focused, State-Specific Tests
test('checkout - cart with single item', async ({ page }) => {
  await page.goto('/checkout');
  await expect(page.getByTestId('cart-summary')).toHaveScreenshot('cart-single-item.png');
});

test('checkout - shipping form validation errors', async ({ page }) => {
  await page.goto('/checkout/shipping');
  await page.getByRole('button', { name: 'Continue' }).click();
  await expect(page.getByTestId('shipping-form')).toHaveScreenshot('shipping-form-errors.png', {
    mask: [page.getByTestId('csrf-hidden-field')],
  });
});

test('checkout - order confirmation', async ({ page }) => {
  await page.clock.setFixedTime(new Date('2026-01-15T10:00:00'));
  await page.goto('/checkout/confirmation?orderId=ORD-88213');
  await expect(page).toHaveScreenshot('order-confirmation.png', {
    mask: [page.getByTestId('order-id')],
    fullPage: true,
  });
});
Step 4: Cover the Responsive Matrix for the Highest-Traffic States
Given checkout is disproportionately mobile traffic for most e-commerce products, the cart summary and payment form specifically get run against the mobile viewport project as well as desktop, while lower-traffic edge states (like a rare discount-stacking scenario) might only be covered at desktop resolution to keep the suite’s maintenance cost proportional to its risk coverage.
Step 5: Wire Into CI With a Required Status Check
The visual regression job is added as a required status check on the checkout service’s repository, meaning a PR touching checkout code cannot merge with an unresolved visual diff — forcing the “is this intentional?” conversation to happen before merge, not after a customer complains about a broken payment form.
Troubleshooting Common Errors
“Screenshot comparison failed: 123 pixels (ratio 0.03 of all image pixels) are different”
This is the standard failure message. First, look at the diff image before doing anything else. If the diff region corresponds to genuinely unmasked dynamic content, add masking or mock the underlying data. If the diff is scattered noise across the whole image rather than concentrated in one region, suspect a font-rendering or OS-level mismatch — verify the baseline was generated in the same Docker image as the CI runner. If the diff corresponds to a real, intentional layout change, review it and run --update-snapshots deliberately.
“Error: A snapshot doesn’t exist”
This means no baseline has been committed yet for this test/browser/platform combination. Either you’re running a genuinely new test for the first time (expected — generate the baseline with --update-snapshots and commit it), or you’re running against a browser project or platform that’s never had a baseline generated for it before (e.g., someone added a new webkit project but baselines were only ever generated for chromium).
Screenshot dimensions don’t match (“expected size 1280×800, received 1280×1600”)
Almost always caused by dynamic content changing the page’s total height between baseline capture and comparison — a banner that sometimes renders and sometimes doesn’t, an error message that appears conditionally, or lazy-loaded content that hadn’t finished loading in one of the two runs. Also check for scale: 'device' vs 'css' mismatches between when the baseline was generated and the current run, since a DPI mismatch produces exactly this symptom.
Tests pass locally but fail consistently in CI (not flaky, always fails)
This is a systemic environment mismatch, not flakiness. Check, in order: (1) is the Playwright version identical between local and CI (check package-lock.json matches what CI installs); (2) is CI using the pinned Docker image, or a bare ubuntu-latest runner with browsers installed via playwright install (different font rendering stack); (3) was the baseline actually generated inside Docker, or was it generated on a developer’s native macOS/Windows machine and just committed as-is.
Visual tests are extremely slow
Large full-page screenshots, especially with fullPage: true on long pages, are disk and CPU intensive to encode and compare. Favor element-level screenshots where full-page coverage isn’t specifically needed, enable Playwright’s test sharding across parallel CI jobs (shown earlier), and confirm you’re not accidentally running the full visual suite against every browser project when a subset would suffice.
Frequently Asked Questions
Does Playwright require a paid plan for Playwright visual regression testing?
No. toHaveScreenshot() and all the configuration options covered in this guide are part of the free, open-source @playwright/test package. There’s no paid tier required for native Playwright visual testing — the paid tools discussed (Percy, Chromatic, Applitools) are separate, optional third-party platforms.
How is Playwright visual regression testing different from Selenium-based screenshot comparison?
Selenium doesn’t ship a built-in visual comparison API — teams historically bolted on external libraries or services for pixel diffing. Playwright’s auto-waiting, bundled deterministic browsers, and native toHaveScreenshot() assertion (with built-in animation freezing and masking) remove several manual steps that Selenium-based visual testing setups required teams to build themselves.
Can I run visual regression tests against a production URL instead of a local/staging build?
Technically yes — point page.goto() at any URL — but this is generally discouraged for regression testing specifically, since production content is often the least deterministic environment (live ads, real user data, A/B tests). Visual regression baselines are most reliable against a staging environment with mocked/fixed data.
How many visual tests should a typical application have?
There’s no universal number, but as a rough anchor: prioritize coverage of your highest-traffic and highest-business-value flows first (signup, checkout, core dashboard), then expand to component-level coverage for your design system. Most teams find diminishing returns well before “every possible page and state,” and suite maintainability degrades faster than most teams expect once a suite crosses a few thousand assertions without disciplined baseline management.
Do visual regression tests replace manual QA or exploratory testing?
No. Visual regression testing catches pixel-level drift against a known baseline — it cannot tell you whether the baseline itself represents good design, good UX, or a genuinely usable interface. A beautifully rendered, pixel-perfect screen that’s confusing to use will pass every visual regression check. Treat it as a complement to, not a replacement for, human design review and exploratory/usability testing.
What’s the biggest mistake teams make when starting with Playwright visual testing?
Generating baselines on a developer’s native machine and expecting them to match a Linux-based CI runner. This single mismatch is responsible for more abandoned visual regression suites than any other single cause I’ve encountered — it produces confusing, seemingly-random failures on every single PR from day one, and teams often conclude “visual testing is too flaky” and disable the suite entirely, when the actual fix (generate baselines inside the same Docker image CI uses) takes minutes to implement.
Complete toHaveScreenshot() API Reference
The sections above covered the options that matter most in day-to-day use. Here’s the exhaustive reference, because I’ve found that teams frequently rediscover options months into a project that would have saved them significant pain if known upfront.
| Option | Type | Default | What It Actually Does |
|---|---|---|---|
| maxDiffPixels | number | undefined | Absolute count of differing pixels allowed before failure. Use instead of, or alongside, maxDiffPixelRatio for small fixed-size elements where a ratio is less intuitive than a raw count. |
| maxDiffPixelRatio | number (0-1) | undefined | Proportion of total pixels allowed to differ. The most commonly tuned option. |
| threshold | number (0-1) | 0.2 | Per-pixel perceptual color distance threshold before pixelmatch counts a pixel pair as different at all. |
| animations | ‘disabled’ | ‘allow’ | ‘allow’ | ‘disabled’ freezes CSS animations/transitions at their end state before capture. Should be a global default in almost every real project. |
| caret | ‘hide’ | ‘initial’ | ‘hide’ | Controls whether the text input caret is hidden before capture. |
| scale | ‘css’ | ‘device’ | ‘css’ | Whether screenshots are captured at CSS pixel or physical device pixel resolution. |
| mask | Locator[] | [] | Array of locators whose bounding boxes are painted over before comparison. |
| maskColor | string (CSS color) | ‘#FF00FF’ | Color used to paint masked regions. Change if pink conflicts with content you’re trying to visually distinguish in diff review. |
| fullPage | boolean | false | Captures the entire scrollable page instead of just the current viewport. |
| clip | {x,y,width,height} | undefined | Captures a specific pixel rectangle regardless of DOM structure. |
| omitBackground | boolean | false | Allows capturing with a transparent background instead of the default white, useful for testing components meant to be composited over varying backgrounds. |
| stylePath | string | string[] | undefined | Path(s) to CSS file(s) injected before capture, typically used to force-hide known-noisy elements globally. |
| timeout | number (ms) | inherits test timeout | Maximum time to wait for the screenshot assertion to pass, including Playwright’s internal retry-and-recompare loop. |
The Internal Retry Loop You Might Not Know About
An underappreciated detail: toHaveScreenshot() doesn’t just take one screenshot and compare it once. Internally, Playwright takes a screenshot, compares it to the baseline, and if it doesn’t match, waits briefly and tries again, repeating until either the images match or the assertion’s timeout is reached. This is by design — it accounts for last-moment layout shifts (a font swap, a lazy-loaded image completing) without you needing to add explicit waits for every such case. But it also means a screenshot assertion can take meaningfully longer than a single capture would suggest, which matters when you’re budgeting CI time for a large suite.
Testing Iframes, Shadow DOM, Canvas, and SVG Content
Standard HTML/CSS layouts are the common case, but real applications frequently include content that needs special handling for reliable visual testing.
Iframes
Playwright can screenshot content inside iframes the same way as the main frame, since toHaveScreenshot() operates on rendered pixels rather than DOM structure — an iframe’s content is part of the page’s rendered output regardless of frame boundaries. The complication is when the iframe’s content is third-party and non-deterministic (a payment provider’s embedded form, an ad iframe, an embedded video player). For those, mask the iframe’s container element rather than trying to control content you don’t own:
await expect(page).toHaveScreenshot('checkout-page.png', {
  mask: [page.frameLocator('#payment-iframe').locator('body')],
});
Shadow DOM
Web components using Shadow DOM render normally in screenshots — visual capture happens at the compositor level, below the DOM abstraction, so open or closed shadow roots don’t require special handling for the screenshot itself. Where it does matter is locating elements inside shadow roots for masking or element-level capture; Playwright’s locators pierce open shadow DOM automatically with standard CSS selectors, but closed shadow roots are not accessible to any DOM-based tooling, Playwright included — if you control the component library, prefer open shadow roots in environments where you need visual test tooling to reach into them.
Canvas and WebGL Content
Canvas-rendered content (charts, data visualizations, WebGL scenes) is captured correctly as pixels, since it’s part of the compositor output like everything else. The challenge is determinism: canvas content driven by animation loops, real-time data, or WebGL rendering with GPU-dependent floating-point behavior can produce genuinely different pixel output across runs or hardware. For canvas-heavy visual tests, favor a higher diff tolerance specifically for those components, freeze any animation loop via a test-only hook, and where possible, seed any randomized visual elements (particle effects, randomized chart colors) with a fixed seed in test mode.
SVG Content
Inline SVG renders and captures normally. The main gotcha is SVG-based icon fonts or icon sprites that load asynchronously via a separate sprite sheet request — if that request hasn’t resolved before the screenshot fires, icons render as empty boxes. Wait for the sprite’s network request to complete, or for a specific icon’s bounding box to have non-zero dimensions, before capturing.
Internationalization, RTL, and Multi-Language Visual Testing
Text expansion and right-to-left (RTL) layouts are a rich source of visual bugs that are almost invisible if your team only ever tests in English. German and Finnish text commonly runs 30-40% longer than English for the same content, which breaks fixed-width buttons, causes text truncation, or forces unexpected line wraps. Arabic and Hebrew flip the entire layout direction, which exposes any hardcoded margin-left or text-align: left that should have used logical properties (margin-inline-start, etc.) instead.
test.describe('locale visual coverage', () => {
  for (const locale of ['en-US', 'de-DE', 'ar-SA'] as const) {
    test(`signup form - ${locale}`, async ({ page }) => {
      await page.goto(`/signup?lang=${locale}`);
      await expect(page.getByTestId('signup-form')).toHaveScreenshot(`signup-form-${locale}.png`);
    });
  }
});
For RTL specifically, also explicitly set the dir attribute and verify Playwright’s viewport/locale emulation matches:
test.use({ locale: 'ar-SA' });I recommend picking at least one “worst case” long-text locale (German or Finnish are good choices) and one RTL locale (Arabic or Hebrew) as permanent fixtures in your visual matrix for any internationalized product, even if you don’t have visual coverage for every supported locale — these two extremes catch the large majority of i18n-driven layout bugs.
Visual Regression Testing in Other CI Providers
The GitHub Actions example earlier is the most common setup I encounter, but the same principles apply directly to other CI systems. Here’s how the equivalent pipeline looks elsewhere.
GitLab CI
visual-tests:
  image: mcr.microsoft.com/playwright:v1.49.0-noble
  stage: test
  script:
    - npm ci
    - npx playwright test tests/visual --reporter=html
  artifacts:
    when: on_failure
    paths:
      - playwright-report/
      - test-results/
    expire_in: 14 days
  rules:
    - if: '$CI_PIPELINE_SOURCE == "merge_request_event"'
CircleCI
version: 2.1
jobs:
  visual-tests:
    docker:
      - image: mcr.microsoft.com/playwright:v1.49.0-noble
    steps:
      - checkout
      - run: npm ci
      - run: npx playwright test tests/visual --reporter=html
      - store_artifacts:
          path: playwright-report
      - store_artifacts:
          path: test-results
Azure DevOps
trigger: none
pr:
  branches:
    include: [main]

pool:
  vmImage: 'ubuntu-latest'

container: mcr.microsoft.com/playwright:v1.49.0-noble

steps:
  - script: npm ci
    displayName: 'Install dependencies'
  - script: npx playwright test tests/visual --reporter=html
    displayName: 'Run visual regression tests'
  - task: PublishBuildArtifacts@1
    condition: failed()
    inputs:
      pathToPublish: 'playwright-report'
      artifactName: 'playwright-visual-report'
The pattern is identical across every provider: pin the exact same Docker image used for local baseline generation, run only on pull/merge request events (visual tests rarely need to run on every push to a long-lived branch), and conditionally publish diff artifacts only on failure to keep artifact storage costs sane.
Rolling Out Visual Regression Testing to a Team: An Adoption Playbook
Technical implementation is only half the challenge. I’ve seen technically excellent visual regression setups fail to stick because the rollout to the wider team wasn’t planned. Here’s the adoption sequence that’s worked for me.
Phase 1: Prove Value on a Narrow Slice (Weeks 1-2)
Resist the urge to instrument the entire application at once. Pick one high-value, relatively stable flow — often the marketing homepage or the pricing page, since these change infrequently and a regression is highly visible and embarrassing if it reaches production. Build 5-10 well-scoped visual tests, get them running reliably in CI with proper Docker-based baseline generation, and let them run for two weeks untouched. The goal here is purely to demonstrate the suite is stable (zero false positives) before asking anyone else to trust it.
Phase 2: Socialize the Review Workflow (Weeks 3-4)
Before expanding coverage, make sure the team understands and has practiced the baseline review-and-approval workflow at least once on a real, intentional design change. This is the point where you deliberately introduce a small visual change (a button color update, a spacing tweak), let the visual test catch it, and walk the team through reviewing the diff image and approving the new baseline. Teams that skip this step often hit their first real baseline-approval situation mid-sprint under time pressure, get confused by the process, and short-circuit it by just force-updating snapshots without review — which undermines the entire safety net from day one.
Phase 3: Expand to Critical Business Flows (Months 2-3)
With the pattern proven and the team comfortable with the review workflow, expand to checkout, signup, and other high-business-value flows identified earlier. This is also the point to introduce responsive/viewport coverage and, if relevant, dark mode / multi-theme coverage.
Phase 4: Component-Level Coverage (Ongoing)
Once flow-level coverage of critical paths is solid, shift toward component-level visual testing for the design system, ideally paired with Storybook if your team has one. This phase never really “completes” — it grows alongside the component library itself, and new components should have visual tests added as part of their definition of done, not retrofitted later.
Common Rollout Failure Modes
- Starting with the whole application at once. Produces a noisy, low-trust suite before the team has learned to tune configuration and handle dynamic content properly.
- No designated owner. Visual regression suites need someone accountable for triaging failures and maintaining baseline hygiene, the same way someone owns flaky functional test triage. Without an owner, the suite decays.
- Treating visual test failures as build breaks to route around, not signals to investigate. If the team’s default reflex to a red visual test is “just update the snapshot,” the suite has already failed at its actual job.
A Visual Testing Maturity Model
Useful for assessing where a team currently stands and what the next investment should be:
Level 0 — No Visual Testing
UI regressions are caught only through manual QA or, worse, by users in production. Functional E2E tests exist but provide zero coverage of visual correctness.
Level 1 — Ad Hoc Screenshot Comparison
A handful of toHaveScreenshot() calls exist, likely added reactively after a specific incident. No consistent configuration, no Docker-based baseline generation, frequent flakiness, low trust.
Level 2 — Configured and Stable Core Coverage
Global configuration defaults are tuned (animations disabled, sensible diff tolerance), baselines are generated inside a pinned Docker image matching CI, and a small set of high-value flows have reliable, low-noise coverage. This is the level most teams should target as a first milestone.
Level 3 — Systematic Coverage With Review Workflow
Coverage extends across critical business flows and design system components. A disciplined, documented baseline review-and-approval process is in place and actually followed. Visual regression is a required CI check on relevant repositories.
Level 4 — Fully Integrated Into the Development Lifecycle
New components and features are expected to ship with visual tests as part of definition of done. Cross-browser, cross-viewport, and multi-locale coverage exists for critical paths. Baseline hygiene is audited periodically. Designers or non-engineering stakeholders have a workflow (whether via a self-hosted report or a paid platform’s review UI) to review visual changes when needed.
Case Studies
Case Study 1: SaaS Analytics Dashboard
A B2B SaaS analytics product with a dense, chart-heavy dashboard had repeatedly shipped layout regressions from a shared component library used across a dozen internal teams — a spacing token change in the design system would silently break card layouts in unrelated product areas, and nobody would notice until a customer flagged it. The fix wasn’t more functional tests (the components rendered correctly in the DOM sense) but component-level visual tests for the roughly 40 shared components, run against every PR to the design system repository specifically. Chart components (canvas-rendered) needed a higher diff tolerance and fixed random seeds for demo data. Within one release cycle, spacing and token-drift regressions dropped to effectively zero, because they were now caught in the design system’s own CI before being published for consumption.
Case Study 2: Regulated Financial Services Application
A banking product with strict compliance requirements around disclosure text rendering needed to guarantee that legally-required text (interest rate disclosures, terms summaries) rendered fully visible and not truncated across every supported viewport and locale. Functional tests confirmed the text was present in the DOM, but couldn’t catch cases where CSS truncation (text-overflow: ellipsis misapplied, or a fixed-height container clipping overflow) hid required text from view. Visual regression tests targeting these specific disclosure components, run across the full viewport matrix (mobile, tablet, desktop) and both supported locales, caught several instances during development where a container height was too short for expanded disclosure text at certain viewport/locale combinations — a compliance risk that no functional assertion would have surfaced, since the text existed in the DOM, it just wasn’t visible.
Case Study 3: Publishing Platform With User-Generated Content
A content publishing platform with rich-text, user-authored articles faced a unique visual testing challenge: content itself was inherently variable, so full-page or even component-level screenshots of real article pages were almost useless as regression baselines — every article looked different by design. The solution was to build visual tests exclusively against a small set of fixed, synthetic “golden” articles specifically crafted to exercise every rich-text formatting feature (headings, blockquotes, embedded images, code blocks, tables, footnotes) in a single deterministic document, rather than testing against real, ever-changing user content. This isolated the visual testing target to “does our article renderer correctly style each content type” rather than trying to visually regression-test infinite variable content, which is a useful pattern any team with heavily user-generated or CMS-driven content should consider.
Security and Privacy Considerations for Visual Testing
Screenshots are an easy thing to overlook from a security and data-privacy perspective, but they deserve explicit attention, especially for regulated industries — a concern I’ve seen underweighted on teams coming from a purely functional-testing background.
Baselines Can Leak Sensitive Data
If your test fixtures use real customer data, or your staging environment is seeded from a sanitized production snapshot that wasn’t fully scrubbed, committed baseline PNGs become a durable, versioned artifact containing that data — sitting in your git history, potentially in a public repository or accessible to a broader set of engineers than your production database is. Always use clearly synthetic test data (fake names, fake account numbers, fake email addresses) for any screen that will be captured as a visual baseline, never data sourced from production, sanitized or not.
Screenshots of Third-Party Embedded Content
Payment iframes, chat widgets, and embedded third-party content sometimes render information you don’t control and shouldn’t be capturing or storing — session tokens rendered for debugging purposes, or a third-party widget that briefly displays account information during its own loading state. Mask these regions rather than relying on the third party’s content being safe to capture, since you don’t control what that content will be on any given test run.
CI Artifact Retention
Diff images and failure artifacts uploaded to CI (as shown in the GitHub Actions example earlier) are typically visible to anyone with repository access, and depending on your CI provider’s configuration, potentially to anyone with a shareable artifact link. Set a sensible retention period (I use 14 days in the examples above) rather than indefinite retention, and treat CI artifact storage with the same data-handling policy you’d apply to any other system that might transiently hold data resembling production content.
Performance Optimization for Large Visual Test Suites
As coverage grows past a few hundred visual assertions, execution time and CI cost become real constraints. Beyond the sharding approach covered earlier, here are additional levers.
Parallelize Within a Single Machine, Not Just Across Shards
Playwright’s test runner parallelizes across worker processes on a single machine by default. Make sure you’re not accidentally running with workers: 1 (sometimes set to reduce flakiness elsewhere in a suite) for visual-specific test runs, since visual tests are generally more CPU-bound (image encoding and comparison) than network-bound, and benefit significantly from parallel workers.
npx playwright test tests/visual --workers=4
Separate Visual Tests From the Broader E2E Suite
Running visual tests as a distinct test project or a separate CI job from your broader functional E2E suite lets you tune worker count, retries, and reporting independently, and lets you run visual tests on a different cadence if needed (e.g., functional tests on every push, visual tests only on PR events, since they’re typically slower and more expensive per-assertion).
Reduce Unnecessary Full-Page Captures
Full-page screenshots on long, content-heavy pages are disproportionately expensive to encode and compare compared to focused element-level captures. Audit your suite periodically for full-page screenshots that could be scoped down to the specific region that actually needs coverage.
Cache Browser Binaries and Docker Layers in CI
If you’re not using the pre-built Playwright Docker image (which already bundles browsers), make sure your CI configuration caches the Playwright browser binary download step — re-downloading and installing Chromium, Firefox, and WebKit on every single CI run adds minutes of pure overhead that caching eliminates entirely.
Right-Size Your Cross-Browser Matrix
As mentioned earlier, running every visual test against every browser on every PR is rarely worth the cost. A tiered approach — Chromium on every PR, full cross-browser matrix on a nightly schedule or pre-release gate — captures the large majority of cross-browser regressions while keeping PR feedback loops fast.
Migrating an Existing Screenshot Testing Setup to Playwright
Teams coming from Selenium-based screenshot comparison tools, Cypress with a third-party plugin, or a legacy in-house screenshot diffing script often ask how to migrate without losing historical baseline continuity. A few practical notes from having done this migration on real projects:
- Don’t try to reuse old baseline images. Different rendering engines, different browser versions, and different capture mechanisms mean an old Selenium-captured baseline will almost never match a new Playwright-captured screenshot, even for identical UI. Regenerate baselines fresh with Playwright rather than attempting to carry over old ones.
- Migrate incrementally, flow by flow. Rewriting an entire legacy visual suite in one PR is high-risk and hard to review. Migrate one flow at a time, verify stability in CI for a sprint, then move to the next.
- Use the migration as an opportunity to re-scope, not just port. Legacy visual suites often have accumulated redundant or low-value screenshots over time. Migration is a natural checkpoint to prune tests that never catch real regressions and add coverage for flows that were missing it.
- Run old and new suites in parallel briefly if the legacy tool is deeply trusted. For risk-averse teams, running both suites for a short overlap period (a sprint or two) builds confidence that the new Playwright-based suite has equivalent or better coverage before fully decommissioning the old one.
Glossary of Key Terms
BaselineThe reference screenshot considered “correct,” stored and versioned, against which future screenshots are compared.Pixel diffingThe algorithmic comparison of two images at the pixel level to detect differences, typically using perceptual color distance rather than exact byte matching.Diff imageA generated image highlighting exactly which pixels differed between the baseline and the new screenshot, used during review.MaskingCovering a specific region of a screenshot with a solid color before comparison, so that region is excluded from the diff regardless of its content.Flaky testA test that produces inconsistent pass/fail results across runs without any underlying code change, undermining trust in the suite.Anti-aliasingThe smoothing of jagged edges (particularly around text and curves) via sub-pixel color blending; a common, usually meaningless source of pixel-level differences between otherwise identical renders.Device pixel ratio (DPR)The ratio between physical device pixels and CSS pixels; high-DPI (“Retina”) displays typically have a DPR of 2 or 3, which affects raw screenshot resolution if not explicitly controlled.Visual AIA term used by some commercial platforms (notably Applitools) for machine-learning-based image comparison that aims to distinguish meaningful layout/content changes from meaningless rendering noise more intelligently than simple pixel diffing.
Visual Testing Behind Authentication
Most valuable application screens sit behind a login wall, and re-authenticating through the actual login UI before every visual test is slow and adds an unnecessary source of flakiness (the login form itself becomes a dependency for every other test). Playwright’s storageState mechanism solves this cleanly by letting you authenticate once and reuse the resulting session across your entire visual suite.
// auth.setup.ts
import { test as setup } from '@playwright/test';

setup('authenticate', async ({ page }) => {
  await page.goto('/login');
  await page.getByLabel('Email').fill('qa-visual-test@qatribe.in');
  await page.getByLabel('Password').fill(process.env.TEST_USER_PASSWORD!);
  await page.getByRole('button', { name: 'Sign in' }).click();
  await page.waitForURL('/dashboard');
  await page.context().storageState({ path: 'playwright/.auth/user.json' });
});
// playwright.config.ts
export default defineConfig({
projects: [
{ name: 'setup', testMatch: /auth\.setup\.ts/ },
{
name: 'visual-tests',
use: { storageState: 'playwright/.auth/user.json' },
dependencies: ['setup'],
},
],
});This runs the authentication flow exactly once per test run (not once per test), and every subsequent visual test starts already logged in, eliminating both the time cost and the flakiness risk of repeatedly exercising the login form as an implicit dependency of unrelated visual assertions. Use a dedicated, clearly-named test account (never a real employee or customer account) and store credentials as CI secrets, never hardcoded in the repository.
Testing Multiple User Roles Visually
Applications with role-based UI (admin vs. standard user, free vs. paid tier) benefit from maintaining separate stored auth states per role, so you can visually verify that role-gated UI elements render correctly for each role without re-authenticating inline in every test:
setup('authenticate as admin', async ({ page }) => {
  // ... login as admin
  await page.context().storageState({ path: 'playwright/.auth/admin.json' });
});

setup('authenticate as free-tier user', async ({ page }) => {
  // ... login as free-tier user
  await page.context().storageState({ path: 'playwright/.auth/free-tier.json' });
});
Handling Cookie Consent Banners and Third-Party Overlays
GDPR/CCPA cookie consent banners, promotional overlays, and “download our app” interstitials are a near-universal source of visual test noise for any customer-facing product, because their presence, position, and even existence can vary based on geolocation detection, prior consent state, or A/B test assignment. A few reliable handling strategies:
- Pre-set consent state via cookies or localStorage before navigation so the banner never renders at all during the test, rather than trying to dismiss it after the fact:
await page.context().addCookies([ { name: 'cookie_consent', value: 'accepted', domain: 'yourapp.com', path: '/' }, ]); await page.goto('/dashboard'); - If the banner can’t be suppressed via state, explicitly dismiss it and wait for it to be fully removed from the DOM before capturing, rather than just clicking dismiss and immediately screenshotting (the dismissal often has its own exit animation, which
animations: 'disabled'should handle, but verify). - Never mask a consent banner and leave it visible in baselines. If your baseline permanently includes a cookie banner, every real user who has already consented (and therefore never sees the banner) is looking at a UI state your test suite never actually validates.
Visual Regression Testing and Feature Flags
Feature-flagged UI presents a specific challenge: the same route can render meaningfully different UI depending on flag state, and your baselines need to account for that explicitly rather than being at the mercy of whatever the flag service happens to return during a given test run.
test('dashboard - new-nav flag enabled', async ({ page }) => {
  await page.route('**/api/feature-flags', route =>
    route.fulfill({ body: JSON.stringify({ 'new-nav': true }) })
  );
  await page.goto('/dashboard');
  await expect(page).toHaveScreenshot('dashboard-new-nav-on.png');
});

test('dashboard - new-nav flag disabled', async ({ page }) => {
  await page.route('**/api/feature-flags', route =>
    route.fulfill({ body: JSON.stringify({ 'new-nav': false }) })
  );
  await page.goto('/dashboard');
  await expect(page).toHaveScreenshot('dashboard-new-nav-off.png');
});
Mocking the flag service response, rather than relying on your actual flag provider’s live state during test execution, keeps the test deterministic and independent of whatever rollout percentage or targeting rules happen to be configured in production at test time — which is exactly the kind of external non-determinism that turns a visual suite flaky for reasons that have nothing to do with your code.
Slack and Team Notification Integration for Visual Failures
For teams where visual regression failures need to be visible beyond just the CI pipeline UI, a lightweight custom reporter (or a post-run script) posting to Slack on failure closes the loop, particularly useful for a suite that runs on a schedule (nightly cross-browser runs) rather than only on PRs where the failure is already visible in the PR checks.
// visual-slack-reporter.ts
import type { Reporter, TestResult } from '@playwright/test/reporter';

class VisualSlackReporter implements Reporter {
  private failures: string[] = [];

  onTestEnd(test: any, result: TestResult) {
    if (result.status === 'failed' && test.title.includes('visual')) {
      this.failures.push(test.title);
    }
  }

  async onEnd() {
    if (this.failures.length === 0) return;
    await fetch(process.env.SLACK_WEBHOOK_URL!, {
      method: 'POST',
      body: JSON.stringify({
        text: `:warning: ${this.failures.length} visual regression test(s) failed:\n${this.failures.map(f => `- ${f}`).join('\n')}`,
      }),
    });
  }
}
export default VisualSlackReporter;
Register it alongside your other reporters in playwright.config.ts, and reserve this pattern for scheduled/nightly runs rather than every PR run, since PR-level failures are already surfaced through the standard CI status check and a Slack message per PR failure quickly becomes noise the team tunes out.
Visual Testing Beyond the Browser Viewport: PDFs, Emails, and Print Styles
Testing Generated PDFs Visually
Many applications generate PDFs server-side (invoices, reports, contracts) or client-side via a browser’s print rendering. If your PDFs are generated by rendering an HTML page and printing it (a common pattern using headless Chromium’s own PDF generation), you can visually regression-test the print-formatted HTML directly, before it’s converted to PDF, using Playwright’s print media emulation:
test('invoice - print layout', async ({ page }) => {
  await page.emulateMedia({ media: 'print' });
  await page.goto('/invoices/INV-2026-001/print-preview');
  await expect(page).toHaveScreenshot('invoice-print-layout.png', {
    fullPage: true,
  });
});
This catches print-stylesheet-specific regressions (a @media print rule that hides a required section, or a page-break rule that splits a table incorrectly) that would be invisible in normal screen-mode visual tests, since screen and print stylesheets are entirely separate rule sets that only apply under their respective media contexts.
If you need to verify the actual rendered PDF file itself (not just the HTML that generates it), that falls outside Playwright’s screenshot API — you’d typically rasterize specific PDF pages to images using a separate PDF-processing library and then run those rasterized images through the same pixelmatch-based comparison logic, or maintain that as a distinct visual testing pipeline outside Playwright entirely. For most teams, testing the pre-conversion HTML print layout, as shown above, is a good stopping point that provides high signal at low implementation cost.
Testing Transactional Email Templates
HTML email templates are notorious for rendering inconsistently across email clients (Outlook’s rendering engine, in particular, is based on Word’s HTML engine and diverges significantly from any browser). Playwright can’t test rendering inside actual email clients, but it can visually regression-test the underlying HTML template as rendered in a browser context, which catches template-authoring bugs (broken table layouts, missing alt text placeholders, malformed inline styles) before they reach an email-specific rendering test service:
test('welcome email template renders correctly', async ({ page }) => {
  await page.goto('/internal/email-preview/welcome?locale=en-US');
  await expect(page).toHaveScreenshot('welcome-email-en.png', { fullPage: true });
});
For genuine cross-email-client rendering verification (Outlook, Gmail, Apple Mail rendering differences), dedicated tools like Litmus or Email on Acid remain necessary — Playwright’s role here is catching template-source regressions early in your own CI, not replacing email-client-specific rendering verification.
Visual Testing Under Network Throttling and Degraded Conditions
UI states during slow network conditions — skeleton loaders, progressive image loading, partial content states — are rarely covered by visual tests because they’re inherently timing-dependent, yet these are exactly the states a meaningful fraction of real users see on slower connections. Playwright supports network throttling via Chrome DevTools Protocol for Chromium-based projects:
test('dashboard - loading skeleton state', async ({ page, context }) => {
  const client = await context.newCDPSession(page);
  await client.send('Network.emulateNetworkConditions', {
    offline: false,
    downloadThroughput: (500 * 1024) / 8,
    uploadThroughput: (500 * 1024) / 8,
    latency: 400,
  });
  await page.goto('/dashboard');
  await expect(page.getByTestId('dashboard-skeleton')).toHaveScreenshot('dashboard-skeleton.png');
});
Rather than relying purely on network throttling timing (which reintroduces the exact non-determinism this guide has spent considerable time warning against), a more reliable pattern is to intercept the relevant API call and deliberately delay its response using route.fulfill() with a controlled delay, capturing the skeleton state in the deterministic window before the delayed response resolves:
test('dashboard - loading skeleton state (deterministic)', async ({ page }) => {
  await page.route('**/api/dashboard/data', async route => {
    await new Promise(resolve => setTimeout(resolve, 2000));
    await route.fulfill({ status: 200, body: JSON.stringify({ /* data */ }) });
  });
  const navigationPromise = page.goto('/dashboard');
  await expect(page.getByTestId('dashboard-skeleton')).toHaveScreenshot('dashboard-skeleton.png');
  await navigationPromise;
});
This approach is far more reliable in CI than actual network throttling, since it doesn’t depend on real timing races between the throttled response and the screenshot capture — the delay is explicit and controlled entirely by your test code.
Extended FAQ
Can I use toHaveScreenshot() with React, Vue, or Angular applications?
Yes — Playwright operates at the browser/DOM level, completely independent of whatever frontend framework rendered the page. There’s no framework-specific integration required; you navigate to the rendered page (or a specific route/component preview, as with the Storybook pattern shown earlier) exactly as you would for any other visual test.
How do I handle screenshots for components that use CSS-in-JS with dynamically generated class names?
This isn’t actually a visual testing concern — dynamically generated class names (common in CSS-in-JS libraries like styled-components or Emotion) don’t affect the rendered pixels at all, since visual comparison operates on the final rendered output, not the underlying CSS class names or selectors. It only matters if you’re using those class names as locators for element-level screenshots, in which case prefer stable data-testid attributes over dynamically generated class names for any element you plan to target in tests.
Should visual regression tests run on every commit, or only on pull requests?
Pull requests, generally. Running the full visual suite on every commit to a shared branch (rather than gating merges) provides diminishing value relative to its CI cost, since the goal is to catch regressions before they merge, not after. A lighter-weight, faster subset (or none at all) on direct pushes to shared branches, with the full suite required as a PR gate, is the pattern I recommend for most teams.
How do I visually test a single-page application’s route transitions?
Capture screenshots at the specific, stable end-state of each route after navigation completes, using an explicit wait for a route-specific element to be visible rather than relying on a fixed delay after triggering navigation. Testing the transition animation itself (the movement between states) generally isn’t a good fit for static screenshot comparison — if the transition’s correctness genuinely matters, that’s better covered by a targeted assertion on the animation’s CSS properties or duration, not a pixel-diffed screenshot of an inherently moving target.
What happens if two developers update the same baseline simultaneously in different branches?
This produces a standard git merge conflict on the binary PNG file, which git can’t auto-merge (unlike text). Whichever branch merges second needs to regenerate that baseline against the now-current main branch state and re-commit it — there’s no way to “merge” two different PNG baselines. This is a good argument for keeping baseline-affecting changes (design system updates, layout changes to shared components) in smaller, more frequently merged PRs rather than long-lived branches, to minimize the window where this kind of conflict can occur.
Is it worth visually testing third-party embedded widgets I don’t control?
Generally no, for the widget’s internal content — you can’t fix bugs in code you don’t own, and the widget’s content is often the least deterministic part of your page. It is worth visually testing that the widget’s container renders at the correct size, position, and doesn’t break your surrounding layout, while masking the widget’s actual internal content.
Can Playwright visual regression testing replace design QA / Figma comparison?
No — Playwright visual regression testing verifies “did this change from the last approved state,” not “does this match the design spec.” A component can be pixel-perfect-stable in your visual suite for months while still not matching what the designer originally intended, if the very first baseline itself was never actually compared against Figma. Pair Playwright visual regression testing (catches drift over time) with an initial, deliberate design QA pass (catches whether the baseline itself is correct) rather than treating one as a substitute for the other.
How long should I keep failed visual test artifacts (diff images) in CI storage?
Two to four weeks is typically sufficient for practical debugging and PR review purposes, balanced against CI storage costs. Longer retention rarely adds value, since a failed visual test is either resolved (baseline updated or bug fixed) within that window, or the PR itself is abandoned.
Do I need a real device lab for Playwright visual regression testing, or is emulation sufficient?
Playwright’s device emulation (viewport size, user agent, touch capability) is sufficient for the large majority of layout and responsive-breakpoint regression testing. It does not perfectly replicate real mobile Safari or mobile Chrome rendering quirks on actual hardware — for products where mobile-specific rendering fidelity is business-critical, supplementing emulated visual tests with periodic manual verification on real devices, or a real-device cloud testing service, is a reasonable addition rather than a replacement.
Setting Up Percy, Chromatic, and Applitools With Playwright: Code-Level Comparison
Since the earlier comparison section covers strengths and weaknesses conceptually, here’s what actually integrating each platform with an existing Playwright suite looks like in practice, so you can weigh the real implementation cost, not just the marketing pitch.
Percy + Playwright
npm install --save-dev @percy/cli @percy/playwright
import { test } from '@playwright/test';
import percySnapshot from '@percy/playwright';

test('homepage visual snapshot', async ({ page }) => {
  await page.goto('/');
  await percySnapshot(page, 'Homepage');
});
npx percy exec -- npx playwright test
Percy replaces Playwright’s own comparison mechanism entirely — percySnapshot() uploads the DOM snapshot (not just a flat image) to Percy’s infrastructure, where it’s re-rendered across Percy’s own browser grid and compared against baselines stored in Percy’s dashboard, not in your git repository. This is the key architectural difference from native Playwright visual testing: Percy captures the DOM and CSS, then does the actual rendering and comparison server-side, which is how it achieves consistent cross-browser rendering without you managing Docker images yourself.
Chromatic + Playwright
Chromatic is most commonly paired with Storybook rather than directly with Playwright test files, but Chromatic does support Playwright-driven visual tests via its TurboSnap and CLI tooling for full-application (not just component) coverage:
npm install --save-dev chromatic
npx chromatic --playwright
For the more common Storybook-based workflow, Chromatic’s build step runs automatically against every story in your Storybook build, requiring no per-test integration code at all — coverage is essentially “free” for every story you already maintain, which is Chromatic’s core value proposition for component-library-first teams.
Applitools + Playwright
npm install --save-dev @applitools/eyes-playwright
import { test } from '@playwright/test';
import { Eyes, Target, VisualGridRunner } from '@applitools/eyes-playwright';

test('homepage - applitools visual AI', async ({ page }) => {
  const runner = new VisualGridRunner({ testConcurrency: 5 });
  const eyes = new Eyes(runner);
  await eyes.open(page, 'QA Tribe App', 'Homepage Test');
  await page.goto('/');
  await eyes.check('Homepage', Target.window().fully());
  await eyes.closeAsync();
});
The VisualGridRunner is what dispatches rendering across Applitools’ cross-browser/cross-device grid rather than relying on your local or CI-hosted browser instance for the actual comparison — you drive the test with your locally running Playwright browser, but the visual comparison itself is offloaded to Applitools’ infrastructure, including their proprietary Visual AI diffing engine, which is the core differentiator justifying the platform’s premium pricing.
What This Comparison Reveals
All three third-party platforms share an architectural pattern: your Playwright test drives the browser interaction and application state as normal, but the actual screenshot capture, storage, and comparison logic is handed off to the platform’s own infrastructure and dashboard, rather than staying local to your repository and CI pipeline. This is the fundamental tradeoff versus native Playwright visual testing — you gain infrastructure and tooling you don’t have to build or maintain yourself, at the cost of external dependency, recurring cost, and baselines living outside your git history.
Test Data Management for Visual Regression Suites
Deterministic visual tests require deterministic test data, and as a suite grows, ad hoc inline fixtures scattered across test files become a maintenance burden. A more scalable pattern is a centralized, versioned fixture library specifically for visual tests.
// fixtures/visual-fixtures.ts
export const visualFixtures = {
  dashboardStats: {
    activeUsers: 4213,
    revenue: 128500,
    lastUpdated: '2026-01-15T10:00:00Z',
  },
  emptyDashboardStats: {
    activeUsers: 0,
    revenue: 0,
    lastUpdated: null,
  },
  cartSingleItem: {
    items: [{ id: 'sku-123', name: 'Wireless Mouse', price: 29.99, qty: 1 }],
    subtotal: 29.99,
  },
} as const;
import { visualFixtures } from '../fixtures/visual-fixtures';
test('dashboard - populated state', async ({ page }) => {
await page.route('**/api/dashboard/stats', route =>
route.fulfill({ body: JSON.stringify(visualFixtures.dashboardStats) })
);
await page.goto('/dashboard');
await expect(page).toHaveScreenshot('dashboard-populated.png');
});
test('dashboard - empty state', async ({ page }) => {
await page.route('**/api/dashboard/stats', route =>
route.fulfill({ body: JSON.stringify(visualFixtures.emptyDashboardStats) })
);
await page.goto('/dashboard');
await expect(page).toHaveScreenshot('dashboard-empty.png');
});Centralizing fixtures this way has a secondary benefit beyond deduplication: it becomes trivial to audit exactly which data states your visual suite covers (populated, empty, error, loading, edge-case-long-content) by simply reading the fixture file, rather than needing to trace through dozens of individual test files to understand coverage.
Covering Edge-Case Content Lengths
A specific fixture category worth deliberately maintaining: unusually long or unusually short content values, since these are exactly the inputs that expose truncation bugs, unexpected wrapping, or layout overflow that “normal” test data never triggers:
export const edgeCaseFixtures = {
  longUserName: { name: 'Alessandro Bartholomew Wolfeschlegelsteinhausenbergerdorff' },
  emptyUserName: { name: '' },
  longProductTitle: {
    title: 'Professional Grade Wireless Ergonomic Mouse With Extended Battery Life And Programmable Buttons For Power Users',
  },
};
I’ve found that a single visual test using a deliberately long-content fixture catches more real truncation and overflow bugs than an entire suite of tests using realistic, “normal-length” sample data — normal data rarely exercises the CSS edge cases that actually break in production when a real customer has an unusually long name or a product has an unusually long title.
Measuring Visual Test Suite Health: Metrics That Matter
Once a visual regression suite reaches meaningful scale, “is it green or red” stops being a sufficient signal for whether the suite is actually healthy and trusted. A handful of metrics, tracked over time, tell you far more.
False Positive Rate
The proportion of visual test failures that, upon review, turn out to be noise (rendering non-determinism, unmasked dynamic content) rather than genuine regressions or intentional changes. This is the single most important health metric for a visual suite — a suite with a high false positive rate is one your team will eventually stop trusting and start ignoring, regardless of how comprehensive its coverage is. I track this by tagging each baseline-update PR with whether it was triggered by a genuine bug, an intentional change, or noise, and reviewing the ratio monthly. A false positive rate above roughly 5-10% of failures is a strong signal that configuration (diff tolerance, masking, animation handling) needs attention before adding more coverage.
Time to Baseline Approval
How long, on average, does it take from a visual test failing due to an intentional change to that baseline being reviewed and approved? A long approval cycle (days, rather than hours) suggests the review workflow itself has friction — too many people required to approve, no clear owner, or a review UI that’s too cumbersome to use regularly. This directly affects developer experience: a slow baseline approval process is exactly the kind of friction that leads developers to bypass the process by force-updating snapshots without real review.
Suite Execution Time Trend
Tracked over time, not just as a single snapshot — a visual suite that’s growing 20% in test count but 80% in execution time indicates something beyond simple coverage growth (unnecessary full-page captures creeping in, insufficient parallelization, redundant browser matrix coverage) and is worth investigating before it becomes a CI bottleneck that slows down every PR.
Coverage by Business-Critical Flow
Rather than a raw test count, map visual coverage against your actual critical user flows (signup, checkout, core dashboard, settings) and track which flows have solid coverage versus which are still gaps. This is more useful for prioritization conversations with engineering leadership than “we have 340 visual tests,” which says nothing about whether the tests that matter most actually exist.
A Simple Dashboard Approach
For teams without budget for a dedicated visual testing platform’s built-in analytics, a lightweight approach is a scheduled script that parses Playwright’s JSON reporter output after each CI run and appends key metrics to a simple time-series store (even a spreadsheet or a lightweight database table is sufficient for most team sizes):
// parse-visual-metrics.ts
import fs from 'fs';

const report = JSON.parse(fs.readFileSync('playwright-report/results.json', 'utf-8'));

const visualTests = report.suites.flatMap((s: any) => s.specs)
  .filter((spec: any) => spec.title.includes('visual'));

const metrics = {
  date: new Date().toISOString(),
  total: visualTests.length,
  passed: visualTests.filter((t: any) => t.ok).length,
  failed: visualTests.filter((t: any) => !t.ok).length,
  durationMs: report.stats.duration,
};

console.log(JSON.stringify(metrics));
// Append to your metrics store of choice — a CSV, a database, a monitoring service
This doesn’t need to be sophisticated to be useful — even a simple weekly trend chart of pass rate and execution time, reviewed briefly in a team retro, is enough to catch a suite quietly degrading before it becomes a crisis.
Advanced Masking Patterns
The basic mask: [locator] pattern covers most cases, but a few advanced scenarios come up often enough to be worth documenting explicitly.
Masking a Dynamic Number of Elements
When the number of matching elements is itself variable (e.g., a notification list that can contain zero to many items, each with a timestamp), pass a locator that matches all instances rather than trying to mask by index, since Playwright’s mask option accepts a locator that can resolve to multiple elements:
await expect(page.getByTestId('notification-list')).toHaveScreenshot('notifications.png', {
  mask: [page.getByTestId('notification-timestamp')], // matches all instances
});
Conditionally Masking Based on Environment
Some content is dynamic in staging (real-time data feeds) but static in a fully mocked test environment. Rather than maintaining separate test files, a helper function that computes the mask list based on environment configuration keeps a single test file usable across contexts:
function getDynamicMasks(page: Page, env: string) {
  const masks = [page.getByTestId('timestamp')];
  if (env === 'staging') {
    masks.push(page.getByTestId('live-feed'));
  }
  return masks;
}

test('dashboard visual', async ({ page }, testInfo) => {
  await page.goto('/dashboard');
  await expect(page).toHaveScreenshot('dashboard.png', {
    mask: getDynamicMasks(page, process.env.TEST_ENV || 'local'),
  });
});
Masking Based on Content Rather Than Location
Occasionally the dynamic element isn’t identifiable by a stable test ID (third-party-injected content without predictable selectors). In these cases, a broader strategy — hiding the element via injected CSS before the screenshot, using the stylePath option covered earlier, or explicitly removing the element from the DOM via page.evaluate() before capture — is more robust than trying to construct a fragile CSS selector against markup you don’t control:
await page.evaluate(() => {
  document.querySelectorAll('[data-third-party-widget]').forEach(el => el.remove());
});
await expect(page).toHaveScreenshot('page-without-widget.png');
Removing an element entirely (rather than masking it) does change the page’s layout if the element takes up space, so this is only appropriate when you specifically want to test the page’s behavior independent of that widget’s presence — for testing the widget’s container/layout impact specifically, masking in place (which preserves the space it occupies) is the correct choice instead.
Complete Tutorial: Building a Visual Regression Suite From Scratch
Everything covered so far has been conceptual and example-driven. This section walks through building an actual, complete visual regression suite for a small application, start to finish, so you have a concrete reference project structure to adapt.
Step 1: Project Structure
my-app/
  tests/
    visual/
      fixtures/
        visual-fixtures.ts
      auth.setup.ts
      homepage.visual.spec.ts
      dashboard.visual.spec.ts
      checkout.visual.spec.ts
      components/
        button.visual.spec.ts
        card.visual.spec.ts
    visual-snapshots/          <-- committed baselines live here per test file
  playwright.config.ts
  Dockerfile.visual-tests
  package.json
Step 2: The Config File
// playwright.config.ts
import { defineConfig, devices } from '@playwright/test';

export default defineConfig({
  testDir: './tests/visual',
  fullyParallel: true,
  retries: process.env.CI ? 1 : 0,
  workers: process.env.CI ? 4 : undefined,
  reporter: [['html', { open: 'never' }], ['json', { outputFile: 'playwright-report/results.json' }]],
  use: {
    baseURL: process.env.BASE_URL || 'http://localhost:3000',
    trace: 'retain-on-failure',
  },
  expect: {
    toHaveScreenshot: {
      maxDiffPixelRatio: 0.02,
      threshold: 0.25,
      animations: 'disabled',
      caret: 'hide',
      scale: 'css',
    },
    timeout: 10000,
  },
  projects: [
    { name: 'setup', testMatch: /auth\.setup\.ts/ },
    {
      name: 'chromium-desktop',
      use: {
        ...devices['Desktop Chrome'],
        viewport: { width: 1440, height: 900 },
        storageState: 'playwright/.auth/user.json',
      },
      dependencies: ['setup'],
    },
    {
      name: 'chromium-mobile',
      use: {
        ...devices['iPhone 13'],
        storageState: 'playwright/.auth/user.json',
      },
      dependencies: ['setup'],
    },
  ],
});
Step 3: The Auth Setup
// tests/visual/auth.setup.ts
import { test as setup } from '@playwright/test';

setup('authenticate for visual tests', async ({ page }) => {
  await page.goto('/login');
  await page.getByLabel('Email').fill('visual-test@qatribe.in');
  await page.getByLabel('Password').fill(process.env.VISUAL_TEST_PASSWORD!);
  await page.getByRole('button', { name: 'Sign in' }).click();
  await page.waitForURL('/dashboard');
  await page.context().storageState({ path: 'playwright/.auth/user.json' });
});
Step 4: Fixtures
// tests/visual/fixtures/visual-fixtures.ts
export const dashboardFixture = {
  activeUsers: 4213,
  revenue: 128500,
  chartData: [12, 19, 8, 24, 17, 30, 22],
};

export const emptyDashboardFixture = {
  activeUsers: 0,
  revenue: 0,
  chartData: [],
};
Step 5: The Test Files
// tests/visual/dashboard.visual.spec.ts
import { test, expect } from '@playwright/test';
import { dashboardFixture, emptyDashboardFixture } from './fixtures/visual-fixtures';

test.describe('dashboard visual regression', () => {
  test('populated dashboard', async ({ page }) => {
    await page.route('**/api/dashboard', route =>
      route.fulfill({ body: JSON.stringify(dashboardFixture) })
    );
    await page.goto('/dashboard');
    await page.evaluate(() => document.fonts.ready);
    await expect(page).toHaveScreenshot('dashboard-populated.png', {
      mask: [page.getByTestId('last-updated-timestamp')],
    });
  });

  test('empty dashboard state', async ({ page }) => {
    await page.route('**/api/dashboard', route =>
      route.fulfill({ body: JSON.stringify(emptyDashboardFixture) })
    );
    await page.goto('/dashboard');
    await expect(page).toHaveScreenshot('dashboard-empty.png');
  });

  test('dashboard card component - hover state', async ({ page }) => {
    await page.route('**/api/dashboard', route =>
      route.fulfill({ body: JSON.stringify(dashboardFixture) })
    );
    await page.goto('/dashboard');
    const card = page.getByTestId('revenue-card');
    await card.hover();
    await expect(card).toHaveScreenshot('revenue-card-hover.png');
  });
});
Step 6: The Dockerfile for Consistent Baseline Generation
# Dockerfile.visual-tests
FROM mcr.microsoft.com/playwright:v1.49.0-noble
WORKDIR /app
COPY package*.json ./
RUN npm ci
COPY . .
CMD ["npx", "playwright", "test", "tests/visual"]
# package.json scripts
"scripts": {
  "test:visual": "playwright test tests/visual",
  "test:visual:update": "docker build -f Dockerfile.visual-tests -t visual-tests . && docker run --rm -v $(pwd)/tests/visual/visual-snapshots:/app/tests/visual/visual-snapshots visual-tests npx playwright test tests/visual --update-snapshots"
}
Step 7: First Run and Baseline Generation
npm run test:visual:update
git add tests/visual/visual-snapshots
git commit -m "chore: add initial visual regression baselines"
From here, every subsequent PR runs npm run test:visual in CI (using the same Docker image, but without --update-snapshots), comparing against the committed baselines and failing the build on any unreviewed visual diff — exactly the safety net the rest of this guide has been building toward.
Ownership and RACI for Visual Test Suite Maintenance
A recurring failure mode in teams that adopt Playwright visual regression testing successfully at first, then watch it decay over six months, is the absence of clear ownership. Functional test suites tend to have implicit ownership (whoever wrote the feature owns its tests), but visual regression suites, especially once they span design-system-level components and multiple product areas, often fall into an ownership gap. A simple RACI framework helps:
- Responsible for writing and maintaining visual tests for a given component or flow: the engineer(s) who own that component or flow, as part of normal feature development — not a separate “visual testing team” bolted on afterward.
- Accountable for overall suite health (false positive rate, execution time, baseline hygiene): a designated QA lead or platform/DX engineer, reviewed on a regular cadence (I recommend monthly at minimum).
- Consulted on baseline approvals for design-system-level or brand-sensitive components: design/UX stakeholders, since these changes affect the product’s visual identity broadly, not just one team’s feature.
- Informed of suite-wide changes (Playwright version bumps, Docker image updates, config threshold changes): the broader engineering team, since these changes can affect every team’s baselines simultaneously and require coordinated re-generation.
Without this kind of explicit ownership, the most common decay pattern is: a suite is set up well initially, works fine for a few months, then a Playwright version bump or a dependency update silently invalidates a batch of baselines, nobody is clearly responsible for investigating, the failures get bulk-approved without real review just to unblock merges, and from that point the suite is providing false confidence rather than real regression detection.
When NOT to Use Visual Regression Testing
Most guides on any testing technique focus exclusively on when and how to use it, and rarely address when it’s the wrong tool. Visual regression testing has real limits worth being explicit about, because misapplying it in the wrong situations is exactly what generates the noisy, distrusted suites this guide has repeatedly warned against.
Highly Variable, User-Generated Content Pages
As covered in the publishing platform case study earlier, pages whose content is inherently different every time (a social media feed, a search results page with live data, a user’s personalized dashboard with genuinely unpredictable content) are poor candidates for direct visual regression testing unless you can fully control the data via mocking. If you can’t achieve full determinism, either heavily mock the data to make the page deterministic, or accept that this page needs a different testing strategy (functional assertions on specific elements, rather than full visual comparison) instead of forcing visual testing onto content that resists it.
Content That Changes by Design, Frequently and Intentionally
A/B tested marketing pages, frequently rotated promotional banners, or seasonal theming that changes on a schedule create a maintenance burden disproportionate to the value visual regression provides, since you’d be updating baselines almost as often as the content changes — at which point the “regression” signal is drowned out by expected, intentional change noise. For pages like this, narrow your visual coverage to the structural chrome around the variable content (navigation, footer, layout grid) rather than the variable content itself.
Extremely Early-Stage Products With Rapidly Changing UI
A product in active, exploratory design iteration — where the UI is expected to change substantially week over week as the team finds product-market fit — will generate near-constant baseline update overhead from visual regression testing, for relatively little payoff, since the “regression” being caught is usually just expected, ongoing redesign rather than an actual bug. Visual regression testing earns its keep once a UI has reached relative stability and the risk shifts from “we’re actively redesigning this” to “this shouldn’t change unexpectedly.” Introducing it too early in a product’s life is a common reason teams conclude “visual testing doesn’t work for us” when the real issue was timing, not the technique itself.
Pure Logic or Data-Correctness Verification
Visual regression testing tells you pixels match a baseline — it says nothing about whether the underlying data or business logic is correct. A dashboard showing an incorrect revenue figure that happens to be styled identically to the baseline will pass a visual test while being functionally wrong. Don’t substitute visual assertions for functional assertions on data correctness; use both, each for what it’s actually good at.
Comparing Visual Regression Testing to Other UI Testing Techniques
It’s useful to place visual regression testing in context against the other layers of a well-rounded frontend testing strategy, since teams sometimes over-invest in one layer at the expense of others that would catch different bug classes more efficiently.
Unit Tests (Component Logic)
Fast, cheap, and precise for verifying component logic, prop handling, and conditional rendering behavior in isolation. Catch zero visual/layout bugs, since most unit testing frameworks don’t render actual browser layout (jsdom, the common test environment for React/Vue unit tests, doesn’t implement real CSS layout algorithms).
Functional End-to-End Tests
Verify user flows and business logic work correctly across the full stack — the right element exists, the right API call fires, the right navigation happens. Structurally blind to visual/layout correctness, as discussed at length in this guide’s introduction.
Accessibility Audits (axe-core and similar)
Catch programmatic accessibility violations (missing ARIA labels, insufficient color contrast ratios calculated from actual rendered colors, missing alt text) but don’t verify general visual correctness beyond the specific accessibility rules being checked.
Visual Regression Testing
Catches pixel-level layout, styling, and rendering regressions that the other three layers structurally cannot see, at the cost of higher maintenance overhead (baseline management, platform/OS sensitivity, dynamic content handling) than any of the other three layers typically require.
Manual Exploratory QA
Catches usability and design-intent issues no automated technique can — “this button works and looks fine, but its placement is confusing” is a category of feedback none of the above four automated layers can provide. Visual regression testing complements, rather than replaces, this layer, since it only detects drift from a previously-approved baseline, not whether that original baseline itself represented good UX.
A well-rounded frontend testing strategy uses all five layers for what each is actually good at, rather than trying to make any single layer (including visual regression testing) carry more weight than it structurally can.
Extended Best Practices Checklist
A consolidated, practical checklist worth revisiting periodically as your suite grows:
Configuration
- Global
animations: 'disabled'andcaret: 'hide'set as defaults, not per-test. maxDiffPixelRatiotuned per test-type (tighter for small components, looser for full-page captures), not left at library defaults.scale: 'css'anddeviceScaleFactor: 1set explicitly to avoid DPI-driven dimension mismatches.
Environment
- Baselines generated inside the exact same Docker image version used by CI.
- Playwright version and Docker image version pinned and bumped together in a single, deliberate PR.
- CI runs visual tests inside the pinned container image, not a bare OS runner with browsers installed separately.
Test Design
- Dynamic data mocked at the network layer wherever feasible; masking reserved for genuinely uncontrollable content.
- Explicit, descriptive snapshot names used throughout, not auto-generated ones.
- Element-level screenshots as the default granularity; full-page reserved for a deliberately scoped set of critical, relatively static pages.
- Edge-case content fixtures (very long / very short values) included alongside “normal” fixtures.
Process
- Baseline updates require explicit review of the diff image before merge — never auto-approved as part of standard CI.
--update-snapshotsnever runs automatically in a standard CI pipeline; only via an explicit, auditable action.- Clear ownership assigned for suite-wide health, not just individual test authorship.
- Quarterly (at minimum) audit for stale/orphaned baselines and consistently-skipped tests.
Scope
- Coverage prioritized by business-critical flow first, component library second, rather than attempting exhaustive page-by-page coverage from day one.
- Cross-browser matrix scoped intentionally (e.g., Chromium on every PR, full matrix nightly) rather than running everything against every browser by default.
- Visual testing deliberately not applied to highly variable, user-generated, or rapidly-iterating UI where it provides poor signal-to-noise.
Handling Visual Regression Testing for Design System Token Changes
Design system token updates — a spacing scale revision, a color palette adjustment, a typography scale change — are a special category worth dedicated treatment, because a single token change can legitimately cascade into hundreds of visual diffs across an entire application at once, and a review process built for one-off component changes doesn’t scale to that volume gracefully.
Batch Review Strategies
When a token-level change is expected to touch a large number of baselines, treat it as its own dedicated PR, separate from any functional code changes, so the diff review is exclusively about the visual impact of the token change and nothing else muddies that review. Group the diff review by the specific token changed rather than reviewing components in isolation — if a spacing token moved from 8px to 10px, a reviewer scanning “every component affected by this specific token” is a more efficient and more accurate review than scanning “every visual diff in this PR” without that grouping context.
Staged Rollout for High-Blast-Radius Changes
For token changes with especially large blast radius (a base font size change, a primary brand color change), consider a staged approach: update the token behind a feature flag, run visual tests against both the flagged and unflagged states to generate a complete before/after diff set for design review, get explicit design sign-off on the full diff set, and only then merge the token change as the new default. This front-loads the review effort into a single, comprehensive comparison rather than discovering the cascading impact piecemeal across many unrelated PRs in the following weeks.
Pre-Computing Expected Diff Scope
Before merging a large token change, it’s worth running the visual suite against the change locally first (not in CI) specifically to get a count of how many baselines will be affected, so the team has an accurate expectation of review scope going in, rather than being surprised by a PR that suddenly shows 340 failing visual tests with no prior warning.
Visual Regression Testing for Multi-Tenant and White-Labeled Applications
Multi-tenant SaaS products that support tenant-specific branding (custom logos, custom color schemes, custom fonts per customer) face a visual testing challenge structurally similar to dark mode/theme testing, but often with a much larger number of variants, since tenant count can run into the dozens or hundreds rather than the two or three themes typical of light/dark mode.
Testing a Representative Sample, Not Every Tenant
Attempting full visual coverage across every real tenant’s actual branding configuration doesn’t scale and isn’t necessary — the underlying layout and component logic is shared across tenants, and what actually varies is a bounded set of branding parameters (primary color, logo, font family). The more maintainable approach is to define a small set of synthetic “stress test” tenant configurations that deliberately exercise the edges of what’s brand-configurable — a tenant with an unusually long logo aspect ratio, a tenant with a very light primary color that stresses contrast-dependent UI (like a colored button needing readable text), a tenant with a custom font that has notably different character widths than the default:
const tenantFixtures = {
  defaultBranding: { primaryColor: '#2563EB', logoUrl: '/fixtures/logo-standard.png', fontFamily: 'Inter' },
  lightPrimaryColor: { primaryColor: '#FDE68A', logoUrl: '/fixtures/logo-standard.png', fontFamily: 'Inter' },
  wideLogo: { primaryColor: '#2563EB', logoUrl: '/fixtures/logo-wide-banner.png', fontFamily: 'Inter' },
  customFont: { primaryColor: '#2563EB', logoUrl: '/fixtures/logo-standard.png', fontFamily: 'Georgia' },
};

for (const [name, branding] of Object.entries(tenantFixtures)) {
  test(`navigation bar - ${name}`, async ({ page }) => {
    await page.route('**/api/tenant/branding', route =>
      route.fulfill({ body: JSON.stringify(branding) })
    );
    await page.goto('/dashboard');
    await expect(page.getByTestId('nav-bar')).toHaveScreenshot(`nav-bar-${name}.png`);
  });
}
This approach catches the actual bug class that matters — “does our layout hold up under the realistic range of tenant customization” — without the impossible and unnecessary goal of visually testing every individual real tenant’s exact configuration.
Handling Third-Party Font Loading and FOUT/FOIT
Flash of Unstyled Text (FOUT) and Flash of Invisible Text (FOIT) — the brief periods where a page renders with a fallback font before a custom webfont finishes loading, or renders with invisible text during that wait — are a persistent source of visual test non-determinism that deserves explicit handling beyond the general “wait for fonts” guidance mentioned earlier.
Waiting for Specific Font Families, Not Just document.fonts.ready
The generic document.fonts.ready promise resolves once font loading has settled, but in some browser/font-loading-strategy combinations, it can resolve slightly before the browser has actually repainted the page with the newly loaded font, particularly with font-display: swap or font-display: optional CSS strategies. For especially font-sensitive visual tests, waiting for a specific, known text element’s computed font family to match the expected custom font (rather than trusting the fallback-to-ready promise alone) is a more airtight guarantee:
await page.waitForFunction(() => {
  const heading = document.querySelector('h1');
  if (!heading) return false;
  const computedFont = window.getComputedStyle(heading).fontFamily;
  return computedFont.includes('Inter');
});
await expect(page).toHaveScreenshot('homepage-hero.png');
Self-Hosting Fonts for Test Environment Reliability
If your production font loading depends on a third-party CDN (Google Fonts and similar services), consider self-hosting font files specifically for your test/staging environment, or intercepting and serving font requests from a local fixture in tests. This removes an external network dependency from your visual test’s critical path entirely — a slow or rate-limited third-party font CDN response is a source of both flakiness and unnecessary test slowness that’s easy to eliminate once you recognize it as the cause.
Visual Regression Testing for Legacy and Server-Rendered Applications
Not every application is a modern SPA built with a component framework. Server-rendered applications (traditional MVC frameworks, older jQuery-driven UIs, CMS-templated pages) benefit from visual regression testing just as much, though a few practical differences are worth calling out for teams working in these stacks.
No Component-Level Isolation Available
Without a component framework or a tool like Storybook to render individual components in isolation, element-level screenshots become your primary tool for achieving component-like granularity — targeting specific DOM regions via locators, even though the underlying architecture doesn’t have a formal component boundary. This works perfectly well with Playwright’s locator-based toHaveScreenshot(), since it operates on rendered DOM regions regardless of whether those regions map to a framework-level “component” concept.
Full Page Reloads Between Every Interaction
Server-rendered applications that do a full page reload on every navigation or form submission (rather than client-side routing) mean visual tests naturally align with distinct page loads rather than needing special handling for SPA-style route transitions. This is, if anything, slightly simpler to reason about for visual testing purposes, since there’s no ambiguity about “has the client-side transition finished” — a full page load event is an unambiguous, easy-to-wait-for signal of a stable state.
Template-Driven Duplication Across Similar Pages
CMS or template-driven sites often have dozens or hundreds of pages sharing the same underlying template with different content. Rather than visually testing every individual page instance (which provides minimal incremental value once you’ve tested the template pattern itself), focus visual coverage on the template itself using representative content, similar to the “golden article” pattern described in the publishing platform case study earlier — testing the template’s rendering correctness once, rather than redundantly re-testing the same template structure across every page that happens to use it.
A Note on Visual Regression Testing for Regulated Industries (Banking, Insurance, Healthcare)
Having worked extensively in banking and fintech-adjacent QA, a few considerations specific to regulated industries are worth calling out beyond the general disclosure-text example covered in the case studies section earlier.
Screenshot Evidence for Compliance Audits
In some regulated contexts, the visual regression baseline itself — the committed, versioned PNG showing exactly what a compliance-relevant screen looked like at a given point in time, tied to a specific git commit — can serve as useful supporting evidence during an audit or compliance review, demonstrating that required disclosures were rendered correctly at the time a given release shipped. This is a secondary benefit beyond the primary regression-catching purpose, but worth being aware of if your compliance or legal team has ever asked “can we prove what this screen looked like six months ago” — a well-maintained, git-versioned baseline history can partially answer that question in a way most other testing artifacts can’t.
Data Residency and Third-Party Platform Considerations
For regulated-industry teams evaluating third-party visual testing platforms (Percy, Chromatic, Applitools), it’s worth confirming where screenshot data is processed and stored, since even synthetic test data being transmitted to and stored on a third-party’s infrastructure can raise data residency or vendor risk assessment questions that a purely self-hosted, git-based approach (native Playwright visual testing) sidesteps entirely. This is a legitimate factor — beyond cost — in why some regulated-industry teams lean toward native Playwright visual testing over SaaS platforms even when the SaaS platform’s technical capabilities would otherwise be attractive.
Change Control Alignment
Regulated environments frequently have formal change control processes for production releases. A visual regression baseline-approval workflow (reviewed diff, explicit approval, auditable commit history) maps naturally onto existing change-control documentation requirements, since the git commit history of baseline updates already provides a natural audit trail of who approved what visual change and when — worth highlighting to a compliance stakeholder who might otherwise view “automated visual testing” with unwarranted suspicion as a black-box process.
Common Questions From Teams Evaluating Visual Regression Testing for the First Time
“Won’t this just be another test suite we ignore when it’s red?”
This is a legitimate and common concern, and the honest answer is: it will, if the suite isn’t configured and maintained using the practices in this guide — sensible diff tolerance, proper dynamic content handling, Docker-based baseline consistency, and a real review workflow. A poorly configured visual suite absolutely does become exactly this. A well-configured one, rolled out incrementally per the adoption playbook earlier in this guide, tends not to, in my direct experience across multiple production codebases.
“How much engineering time does this realistically cost to maintain?”
For a suite built following the practices in this guide, ongoing maintenance is genuinely light — occasional baseline updates for intentional design changes (a normal, expected part of the workflow, not overhead), periodic version bumps of Playwright and the Docker image (bundled together, done a few times a year), and quarterly hygiene audits for stale baselines. The heavy investment is entirely front-loaded into initial setup and configuration, not ongoing operation, which is a favorable cost curve compared to some other testing investments that require continuous, escalating maintenance as a codebase grows.
“Do designers need to learn Playwright to participate in the review process?”
No. The diff review itself is just looking at two images side by side and deciding if the change is intentional — no code knowledge required. What designers do need is a reasonably accessible way to view that diff (the HTML report, or a platform’s web dashboard if you’re using Percy/Chromatic/Applitools), which is worth factoring into your tooling choice if non-engineering stakeholder review is a frequent, expected part of your workflow rather than an occasional exception.
Debugging a Real Flaky Visual Test: A Step-by-Step Walkthrough
Abstract advice about debugging flakiness is useful, but walking through an actual debugging session end to end makes the process concrete. Here’s a representative example based on a pattern I’ve encountered repeatedly.
The Symptom
A visual test for a product listing page fails intermittently in CI — roughly one in every five to ten runs — with a small diff (under 1% of pixels) scattered across the page rather than concentrated in one region. Locally, on the same branch, the test passes consistently every time.
Step 1: Rule Out Obvious Dynamic Content
The diff image is reviewed first. The scattered, low-magnitude pattern across the whole page (rather than a concentrated block) is the key diagnostic signal — concentrated diffs usually mean a specific dynamic element; scattered, low-magnitude diffs usually mean broad rendering noise, most commonly font rendering or anti-aliasing.
Step 2: Compare Local and CI Environments
The test passes locally on macOS but fails intermittently in CI running on Linux. This immediately raises the environment-mismatch hypothesis discussed earlier in this guide. Checking the CI configuration reveals the workflow was using a bare ubuntu-latest runner with playwright install rather than the pinned Docker image — meaning font rendering depends on whatever font packages happen to be installed on the GitHub-hosted runner image, which can and does vary subtly between runner image versions over time, even without any change to the application code.
Step 3: Fix the Environment, Not the Tolerance
The tempting quick fix is to simply raise maxDiffPixelRatio until the test stops failing. This is explicitly the anti-pattern warned about earlier — it would mask this specific symptom while reducing the test’s actual sensitivity to real regressions everywhere else on the page. Instead, the CI workflow is updated to run inside the pinned mcr.microsoft.com/playwright:v1.49.0-noble container image, matching the Docker image used to generate the baseline locally.
Step 4: Regenerate the Baseline in the Corrected Environment
Since the original baseline was generated on a developer’s macOS machine (not inside Docker, a mistake that had gone unnoticed until this investigation), it’s regenerated fresh inside the pinned Docker image, following the exact workflow described in the Docker section of this guide, and recommitted.
Step 5: Verify Across Multiple Runs
The fixed workflow is run ten additional times in CI (via manual re-triggers) specifically to confirm the intermittent failure no longer reproduces, rather than assuming a single passing run means the issue is resolved — intermittent issues by definition require multiple runs to confidently rule out.
The Broader Lesson
This pattern — an environment mismatch masquerading as “random flakiness,” temptingly fixable by loosening tolerance but correctly fixable by aligning environments — is, in my direct experience, the single most common root cause behind visual test flakiness reports. Before adjusting any diff tolerance setting in response to a flaky test, it’s worth explicitly ruling out an environment mismatch first, since loosening tolerance as a first response frequently treats a symptom while leaving the actual root cause (and its effect on every other test in the suite) unaddressed.
Frequently Overlooked Configuration: Locale, Timezone, and Geolocation Emulation
Beyond font and dynamic-content handling, a few less commonly discussed configuration settings affect visual determinism and are worth setting explicitly rather than leaving to CI-environment defaults.
Timezone
Any UI displaying a formatted local time or date is sensitive to the executing machine’s timezone setting unless explicitly controlled. A CI runner’s default timezone (often UTC, but not guaranteed to stay consistent across provider changes) can silently shift rendered date/time text and, if that text affects layout width, cause a genuine visual diff unrelated to any code change:
test.use({ timezoneId: 'Asia/Kolkata' });Locale
Beyond the i18n-specific testing covered earlier, even for a nominally single-language application, the browser’s locale setting affects default number, currency, and date formatting via the Intl API unless your application explicitly overrides it. Pin this explicitly rather than relying on CI runner defaults:
test.use({ locale: 'en-IN' });Geolocation
For any UI that conditionally renders content based on detected location (region-specific promotions, currency defaults, compliance banners), explicitly setting geolocation emulation removes another source of environment-dependent non-determinism:
test.use({
  geolocation: { latitude: 18.5204, longitude: 73.8567 },
  permissions: ['geolocation'],
});
None of these three settings are visual-testing-specific — they’re general Playwright test configuration — but their downstream effect on visually rendered content is easy to overlook until a CI provider’s runner default silently changes and produces a batch of confusing, seemingly-unrelated visual failures across every locale/time-sensitive test in the suite simultaneously.
Building a Business Case for Playwright Visual Regression Testing
Getting engineering leadership buy-in for investing time in Playwright visual regression testing often requires translating the technical case into terms a non-QA stakeholder will find compelling. Here’s the framing I’ve found most effective.
Quantifying the Cost of Undetected Visual Regressions
Before proposing Playwright visual regression testing as an investment, it’s worth gathering a rough tally of how many production incidents, hotfixes, or customer-reported UI bugs over the past two or three release cycles were visual in nature — layout breaks, overlapping elements, broken responsive behavior — rather than functional bugs. In most codebases without any visual regression testing in place, this number is higher than engineering leadership initially expects, precisely because these bugs are invisible to the existing functional test suite and only surface through customer reports or manual QA that may not catch every screen on every release.
Positioning Playwright Visual Regression Testing as Incremental, Not a New Framework
For any team already using Playwright for functional end-to-end testing, the strongest argument for adopting Playwright visual regression testing specifically (rather than a separate tool) is that it’s not a new framework to learn, evaluate, or maintain — it’s a native capability of a tool already in the stack. This significantly lowers the perceived cost of the proposal compared to introducing an entirely new testing platform, and it’s worth making this framing explicit when pitching the investment.
Starting With a Time-Boxed Pilot
Rather than asking for open-ended investment, propose a two-week, time-boxed pilot scoped to a single high-value flow (as described in the adoption playbook earlier in this guide), with a specific, measurable goal: demonstrate that Playwright visual regression testing can run reliably in CI with a near-zero false positive rate over that period. This is a low-risk ask that produces concrete evidence — either the pilot succeeds and justifies expansion, or it surfaces specific blockers (environment inconsistency, particularly noisy dynamic content) worth addressing before wider rollout.
Reporting Back in Business Terms
When reporting pilot results, translate technical metrics into terms leadership cares about: “this Playwright visual regression testing pilot caught two layout regressions before they reached production, that would previously have required a hotfix and, based on our historical incident data, likely a customer-facing apology” is a more persuasive statement than “we achieved 98% pass rate with 0.02 diff ratio tolerance,” even though both describe the same underlying result.
A Realistic Timeline for Implementing Playwright Visual Regression Testing
Teams frequently ask how long a full Playwright visual regression testing rollout takes, end to end. Based on the adoption playbook and case studies covered throughout this guide, here’s a realistic timeline for a mid-sized product team (roughly 15-40 engineers) implementing this from scratch.
Week 1-2: Foundation
Set up the base configuration (diff tolerance, animation handling, Docker image pinning), build the CI pipeline integration, and implement 5-10 visual tests against a single, stable, high-value page. Validate zero false positives over this period before proceeding.
Week 3-4: Process and Team Onboarding
Document and rehearse the baseline review-and-approval workflow with the team, using a deliberately introduced test change as a training exercise. Assign clear ownership per the RACI framework covered earlier.
Month 2-3: Expansion to Critical Flows
Extend coverage to checkout, signup, core dashboards, and other business-critical flows identified through the same prioritization exercise used in the business-case-building step above. Introduce responsive/viewport coverage for the highest-traffic breakpoints.
Month 3-6: Component-Level and Design System Coverage
Layer in component-level visual testing, ideally paired with Storybook if available, and establish the ongoing practice of new components shipping with visual tests as part of their definition of done.
Ongoing: Maturity and Health Monitoring
From month six onward, the effort shifts from “building the suite” to “maintaining suite health” — tracking the false-positive-rate and execution-time metrics described earlier, conducting quarterly baseline hygiene audits, and evaluating periodically whether a paid platform (Percy, Chromatic, Applitools) has become justified by the suite’s scale or stakeholder review needs, per the decision framework covered in the tool comparison section.
This timeline is deliberately conservative and incremental rather than an aggressive “instrument everything in one sprint” approach, precisely because the incremental path is what actually produces a Playwright visual regression testing suite the team trusts and sustains, rather than one that’s abandoned after an initial burst of enthusiasm collides with unmanaged flakiness.
Summary Table: Playwright Visual Regression Testing Decision Points
| Decision | Default Recommendation | When to Deviate |
|---|---|---|
| Native Playwright vs. paid platform | Start with native Playwright visual regression testing | Non-engineering stakeholders need a review UI, or cross-device coverage exceeds what you can self-host reasonably |
| Full-page vs. element-level screenshots | Element-level for most tests | Full-page for a small set of critical, relatively static pages |
| Masking vs. network mocking for dynamic content | Network mocking wherever feasible | Masking for content you genuinely don’t control (third-party widgets) |
| Cross-browser matrix scope | Chromium on every PR | Full cross-browser matrix on a nightly or pre-release schedule |
| Baseline generation environment | Pinned Docker image matching CI | Never — this should not be deviated from for any team beyond a single contributor |
| diff tolerance (maxDiffPixelRatio) | 0.01-0.02 for components, up to 0.03 for full-page | Tune per test based on observed noise, never leave at library default of near-zero |
Common Mistakes When Writing Playwright Visual Regression Tests (A Code-Level Review)
Beyond the conceptual anti-patterns covered earlier, here’s a code-level before-and-after review of mistakes I encounter repeatedly when reviewing Playwright visual regression testing PRs, alongside the corrected version.
Mistake: Screenshotting Immediately After Navigation
// Problematic
test('product page', async ({ page }) => {
  await page.goto('/products/wireless-mouse');
  await expect(page).toHaveScreenshot('product-page.png');
});
This doesn’t explicitly wait for images, fonts, or any async-loaded content to finish before capturing, relying entirely on Playwright’s internal retry-and-recompare loop to eventually converge — which works, but can mask genuine loading-state race conditions and makes the test slower than necessary since it may go through several retry cycles before stabilizing.
// Corrected
test('product page', async ({ page }) => {
  await page.goto('/products/wireless-mouse');
  await page.getByTestId('product-image').waitFor({ state: 'visible' });
  await page.evaluate(() => document.fonts.ready);
  await expect(page).toHaveScreenshot('product-page.png');
});
Mistake: Overly Broad Masking
// Problematic - masks the entire page content area, defeating the test's purpose
await expect(page).toHaveScreenshot('dashboard.png', {
  mask: [page.locator('main')],
});
This masks essentially the entire visible content of the page, meaning the visual test now only verifies the header and footer chrome, providing almost no real regression coverage while still incurring the maintenance cost of a full visual test. Mask narrowly, targeting only the specific dynamic elements that actually require it.
Mistake: No Explicit Snapshot Name
// Problematic
test('renders correctly', async ({ page }) => {
  await page.goto('/settings');
  await expect(page).toHaveScreenshot();
});
Auto-generated snapshot names tied to the test title become invalid the moment someone renames the test, silently orphaning the old baseline file and generating a new one, which can mask what should have been a deliberate baseline review.
// Corrected
test('settings page renders correctly', async ({ page }) => {
  await page.goto('/settings');
  await expect(page).toHaveScreenshot('settings-page.png');
});
Mistake: Testing Implementation Detail Instead of User-Visible Output
// Problematic - screenshots an internal wrapper div with no visual significance
await expect(page.locator('.internal-layout-wrapper-v2')).toHaveScreenshot('wrapper.png');
Target visually meaningful, user-facing regions using stable, semantic locators (test IDs, roles, accessible names) rather than internal implementation-detail selectors that carry no visual significance of their own and are liable to change during unrelated refactors, causing spurious test breakage.
Mistake: Ignoring the animations Setting at the Test Level When It Matters Most
// Problematic - global config has animations enabled for a specific legitimate reason,
// but this test captures a page with an unrelated, unhandled loading spinner
test('checkout summary', async ({ page }) => {
  await page.goto('/checkout');
  await expect(page).toHaveScreenshot('checkout-summary.png');
});
// Corrected - explicit per-test override
test('checkout summary', async ({ page }) => {
await page.goto('/checkout');
await expect(page).toHaveScreenshot('checkout-summary.png', {
animations: 'disabled',
});
});Even with a sensible global default, individual projects or test suites sometimes override animations to 'allow' for specific, deliberate reasons (testing an animation’s mid-state, for example) — when that override exists elsewhere in the config hierarchy, individual tests capturing unrelated pages still need the explicit per-test setting to avoid inheriting an inappropriate default.
Final Thoughts on Sustaining Playwright Visual Regression Testing Long-Term
Everything in this guide ultimately serves one goal: building a Playwright visual regression testing practice that survives contact with a real, evolving production codebase over years, not just the initial few weeks of enthusiasm after setup. The technical configuration — diff tolerance, masking, Docker-based environment consistency — solves the flakiness problem. The process discipline — explicit baseline review, clear ownership, incremental rollout — solves the trust problem. Both are necessary; neither alone is sufficient. A perfectly configured suite with no review discipline degrades into a rubber stamp. A well-governed suite with poor configuration degrades into noise nobody trusts enough to govern carefully in the first place.
Playwright visual regression testing, done well, becomes one of those testing investments that quietly prevents entire categories of embarrassing, customer-visible bugs without ever making headlines internally — nobody celebrates the layout regression that never shipped, precisely because it never shipped. That’s the nature of good regression testing generally, and it’s worth remembering when justifying the ongoing investment: the value shows up as an absence of incidents, not a visible win, which is exactly why the metrics and health-monitoring practices covered in this guide matter — they make an otherwise invisible form of value legible to the rest of the team and to leadership.
Playwright Visual Regression Testing vs. Manual Screenshot Comparison: Why Automation Wins
Before closing out this guide, it’s worth explicitly addressing a question that comes up in nearly every team’s evaluation process: why invest in Playwright visual regression testing infrastructure at all, when a QA engineer could theoretically just manually compare screenshots before each release? The honest answer is that manual screenshot comparison doesn’t scale, doesn’t run on every PR, and is subject to exactly the kind of human attention lapses that automated Playwright visual regression testing exists to eliminate.
Coverage Consistency
A human reviewer manually comparing screenshots will, understandably, focus attention on the areas of a page they expect to have changed, and is far more likely to miss an unrelated regression in a part of the UI nobody was thinking about during that particular release. Automated Playwright visual regression testing applies the exact same rigorous, pixel-level comparison to every covered region on every single run, with no attention bias toward “the part we were actually working on.”
Speed and Release Cadence
Manual visual comparison is fundamentally incompatible with a fast release cadence — teams shipping multiple times a day cannot realistically insert a manual screenshot review step into every deployment without either slowing releases dramatically or skipping the check entirely under time pressure. Playwright visual regression testing running automatically in CI imposes no such tradeoff; it runs in parallel with the rest of the pipeline and blocks merges only when an actual, reviewable diff is detected.
Objectivity and Reproducibility
Human visual comparison is inherently subjective and inconsistent from reviewer to reviewer, and even inconsistent for the same reviewer across different times of day or levels of fatigue — a two-pixel shift might be caught by one careful reviewer and missed entirely by another equally competent one on a busy day. Playwright visual regression testing applies a consistent, configurable, and fully reproducible comparison algorithm every time, removing that variability entirely.
Where Manual Review Still Matters
None of this means manual visual review becomes obsolete — as covered earlier in the comparison against other testing techniques, human judgment remains essential for evaluating whether a baseline itself represents good design and good UX, which is a fundamentally different question than “did this change from the last approved state.” The right model, and the one this entire guide has been building toward, is automated Playwright visual regression testing catching unintended drift continuously, paired with periodic, deliberate human design review establishing what “correct” should look like in the first place. Treating automated visual regression as a replacement for human design judgment, rather than a complement to it, is a subtle but important distinction worth keeping in mind as you scale your Playwright visual regression testing practice across a growing product and team.
A Final Word on Getting Started
If you’ve read this entire guide and are now wondering where to actually begin, the answer is the same one offered in the adoption playbook: don’t try to build a comprehensive Playwright visual regression testing suite in a single sprint. Pick one page, get the configuration right, prove it’s stable in CI for two weeks, and expand from there using the priorities and patterns covered throughout this guide. Every large, mature Playwright visual regression testing suite I’ve worked on or reviewed started exactly this way — small, deliberate, and expanded only once trust was earned through demonstrated reliability, not assumed from the outset.
Comparing Screenshot File Formats and Storage Considerations
An implementation detail rarely covered in tutorials but relevant once a suite scales: Playwright captures screenshots as PNG by default, which is the correct choice for pixel-diffing purposes since PNG is lossless — a compressed format like JPEG would introduce compression artifacts that vary between captures even for identical content, defeating the purpose of exact pixel comparison. This is worth understanding rather than treating as an arbitrary default, since it explains why you shouldn’t attempt to swap in a lossy format to save repository space, even though PNG files for full-page screenshots of content-heavy pages can be several hundred kilobytes to a few megabytes each.
Repository Size Management
For teams with hundreds of baselines across multiple browser projects and viewport sizes, repository size from committed PNGs can become a genuine consideration, particularly for repository cloning time in CI. A few practical mitigations: prefer element-level screenshots over full-page where the coverage goal allows it (smaller images), periodically prune baselines for deleted or deprecated tests as part of the quarterly hygiene audit described earlier, and for very large suites, consider Git LFS specifically for the snapshot directories, which stores large binary files more efficiently than standard git while keeping the same versioning workflow developers are already used to.
# .gitattributes
tests/**/visual-snapshots/**/*.png filter=lfs diff=lfs merge=lfs -text
Image Optimization Without Losing Diff Fidelity
Standard PNG optimization tools (reducing color palette depth, stripping metadata) can reduce baseline file sizes without affecting the pixel-diffing algorithm’s accuracy, since pixelmatch compares actual rendered pixel values, not file metadata or compression details. Running baselines through a lossless PNG optimizer as part of the baseline-generation script is a reasonable practice for large suites where repository size has become a measurable pain point:
# Using a lossless PNG optimizer after baseline generation
npx playwright test --update-snapshots
find tests/visual -name "*.png" -exec optipng -o2 {} \;
Be cautious with any tool claiming lossless optimization — verify with a byte-level or pixel-level comparison that the optimized image is genuinely pixel-identical to the original before relying on it, since a tool with a bug or an aggressive default that silently introduces even minor lossy compression would corrupt your entire baseline set’s reliability in a way that’s difficult to detect after the fact.
Handling Visual Regression Testing Across Multiple Repositories (Micro-Frontends)
Organizations using a micro-frontend architecture, where different teams own and deploy independent frontend applications that compose into a single user-facing product, face a specific visual testing coordination challenge: a visual regression in one micro-frontend’s shared shell or design system dependency can manifest as a visual break in an entirely different team’s micro-frontend, without that team’s own repository or CI pipeline having any visibility into the change that caused it.
Testing the Composed Experience, Not Just Individual Repositories
The most reliable approach is maintaining a separate, composition-level visual test suite — often owned by a platform or shell team — that runs against a fully integrated staging environment where all micro-frontends are deployed together, rather than relying solely on each micro-frontend’s own isolated visual tests to catch cross-boundary regressions. This composition-level suite is exactly the kind of investment that pays for itself the first time a shared design-system dependency bump silently breaks a completely unrelated team’s UI, which is a common and often painful failure mode in micro-frontend architectures without this safety net.
Coordinating Baseline Updates Across Teams
When a shared dependency change (a design system version bump, a shared CSS reset update) is expected to affect multiple micro-frontends’ visual baselines simultaneously, the same batch-review strategy described earlier for design token changes applies at an organizational level: treat it as a coordinated, cross-team review rather than something the platform team merges unilaterally, since the visual impact spans ownership boundaries that a single team’s review process doesn’t have full visibility into.
Wrapping Up the Technical Foundation
At this point, this guide has covered the complete technical and organizational foundation for Playwright visual regression testing: the underlying pixel-diffing mechanics, every meaningful configuration option, dynamic content handling strategies, cross-browser and cross-platform rendering consistency via Docker, CI/CD integration across major providers, baseline management and review workflows, responsive and multi-theme coverage, comparison against paid third-party platforms, flakiness debugging methodology, and the organizational practices — ownership models, adoption sequencing, business case framing — that determine whether a technically sound suite actually survives and delivers value over years rather than months. The remaining conclusion ties this together with a final, practical starting point.
Sample Pull Request Checklist for Visual Regression Test Changes
A concrete artifact worth adopting directly: a PR template checklist specifically for changes that touch visual baselines, to keep the review discipline described throughout this guide consistent across every contributor rather than relying on individual reviewers to remember every consideration.
## Visual Baseline Update Checklist

- [ ] I reviewed the diff image(s) for every changed baseline in this PR
- [ ] Each visual change is intentional and matches the design/spec (link if applicable)
- [ ] Baselines were regenerated inside the pinned Docker image, not a local machine
- [ ] No unrelated baselines changed unexpectedly (if they did, investigated why)
- [ ] Dynamic content in affected tests is still properly masked/mocked
- [ ] Playwright version in this PR matches the Docker image tag used to generate these baselines
Embedding this directly into the pull request template for any repository containing visual tests removes the need to rely purely on tribal knowledge or a reviewer’s memory, and gives new team members a concrete, actionable definition of what a properly reviewed baseline update actually requires — directly operationalizing the review discipline this guide has emphasized throughout as the difference between a trusted Playwright visual regression testing suite and one that quietly degrades into a rubber stamp.
Sample Reviewer Prompt for Baseline PRs
Beyond the checklist, a short standing note in your team’s PR review guidelines helps set reviewer expectations explicitly:
When reviewing a PR that updates visual baselines, treat the diff image the same way you’d treat a code diff — read it carefully, understand what changed and why, and don’t approve based solely on “the pipeline is green.” A green pipeline on a baseline-update PR only confirms the new screenshot matches itself; it says nothing about whether the change is correct.
This single framing — treating a baseline diff review with the same rigor as a code review, rather than as a formality to unblock a merge — is, more than any specific configuration setting covered in this guide, the practice that most reliably determines whether a Playwright visual regression testing suite remains a trusted safety net or slowly becomes ceremonial. Teams that internalize this distinction tend to sustain high-value visual regression coverage for years; teams that treat baseline updates as routine, low-scrutiny clicks tend to rediscover, usually after a customer-visible incident, that their suite had stopped meaningfully protecting them long before anyone noticed.
Handling Browser Zoom and User Preference Settings in Visual Tests
A category of visual testing occasionally overlooked: real users interact with applications under browser zoom levels, adjusted font sizes, and OS-level accessibility settings (like Windows’ text scaling or macOS’s Display zoom) that differ from the default 100% zoom, 16px-base-font assumptions baked into most visual test suites. For applications with significant accessibility requirements, it’s worth deliberately including a small set of visual tests at common zoom levels to catch layout breaks that only manifest under these conditions:
test('checkout form at 150% browser zoom', async ({ page }) => {
  await page.goto('/checkout');
  await page.evaluate(() => {
    document.body.style.zoom = '1.5';
  });
  await expect(page.getByTestId('checkout-form')).toHaveScreenshot('checkout-form-150-zoom.png');
});
Text that reflows correctly at 100% zoom frequently breaks in subtle ways at 150% or 200% zoom — a fixed-height container that clips content, a horizontal scrollbar that appears unexpectedly, or a button whose label wraps and overflows its container. Because WCAG 2.1 requires content to remain usable up to 400% zoom for certain conformance levels, this isn’t purely a nice-to-have for accessibility-conscious products; it’s frequently a compliance requirement that visual regression testing can help verify continuously, rather than relying solely on periodic manual accessibility audits to catch zoom-related regressions after they’ve already shipped.
Reduced Motion Preference
Users with prefers-reduced-motion enabled at the OS level see a version of your UI with animations and transitions suppressed, if your application respects that media query (as it should, for both accessibility and inclusivity reasons). This is worth explicit visual coverage separate from your standard animation-disabled test configuration, since it verifies your application’s actual reduced-motion CSS rules render a coherent, complete UI — not just that Playwright’s own animation-freezing mechanism happens to produce a similar visual result:
test.use({ reducedMotion: 'reduce' });

test('modal - reduced motion preference respected', async ({ page }) => {
  await page.goto('/dashboard');
  await page.getByRole('button', { name: 'Open settings' }).click();
  await expect(page.getByRole('dialog')).toHaveScreenshot('settings-modal-reduced-motion.png');
});
Including this small set of accessibility-oriented visual tests alongside your core Playwright visual regression testing suite extends the technique’s value beyond pure layout-regression detection into genuine, continuously-verified accessibility conformance for the specific dimensions (zoom, motion preference) that are most amenable to visual verification, complementing the axe-core-based automated accessibility checks covered earlier in this guide rather than duplicating them.
A Quick-Reference Command Cheat Sheet
For day-to-day use once your Playwright visual regression testing suite is up and running, here’s a consolidated set of the commands covered throughout this guide, useful as a bookmarked reference for the whole team.
# Run the full visual suite
npx playwright test tests/visual

# Run and generate baselines for the first time (or intentionally update them)
npx playwright test tests/visual --update-snapshots

# Run inside the pinned Docker image (correct way to generate/update baselines)
docker run --rm -v $(pwd):/work -w /work \
  mcr.microsoft.com/playwright:v1.49.0-noble \
  npx playwright test tests/visual --update-snapshots

# Run a single visual test file
npx playwright test tests/visual/checkout.visual.spec.ts

# Run with a specific number of parallel workers
npx playwright test tests/visual --workers=4

# Run sharded for CI parallelization
npx playwright test tests/visual --shard=1/4

# Generate and open the HTML report after a run
npx playwright test tests/visual --reporter=html
npx playwright show-report

# Run only against a specific browser project
npx playwright test tests/visual --project=chromium-desktop

# Debug a specific failing test interactively
npx playwright test tests/visual/checkout.visual.spec.ts --debug
Pinning this cheat sheet in your team’s internal documentation, alongside the PR checklist and the configuration defaults covered earlier, rounds out the practical toolkit needed to run a mature, trusted Playwright visual regression testing practice day to day, without every team member needing to re-derive these commands from documentation each time they touch the suite.
Anticipating Where Playwright Visual Regression Testing Is Headed
Looking ahead, a few trends are worth tracking for teams building a long-term Playwright visual regression testing practice, since the tooling landscape in this space has evolved meaningfully even over the past couple of years and shows no sign of slowing.
Smarter, More Perceptual Diffing in Open-Source Tooling
The gap between simple pixel-diffing (what Playwright uses natively via pixelmatch) and the AI-assisted “Visual AI” diffing offered by premium platforms like Applitools has historically been one of the strongest arguments for paying for a commercial platform at scale. It’s reasonable to expect open-source diffing approaches to continue narrowing that gap over time, potentially reducing one of the more compelling reasons large teams currently reach for a paid platform purely for noise reduction rather than for review tooling or cross-device coverage.
Tighter Integration With Component Development Workflows
As component-driven development (Storybook and similar tools) continues to be the default way design systems are built and maintained, expect Playwright’s own tooling and ecosystem to keep deepening its integration with these workflows, making component-level Playwright visual regression testing an even lower-friction default than it already is today, rather than something teams need to wire together manually through the Storybook iframe URL pattern shown earlier in this guide.
AI-Assisted Baseline Review
Given the broader trend of AI-assisted tooling across the software development lifecycle, it’s a reasonable expectation that baseline review workflows — currently a manual, human “does this diff look intentional” judgment call — will increasingly be assisted by tooling that can pre-classify a diff as likely noise, likely intentional, or likely a genuine regression, based on patterns learned from a team’s own historical review decisions. This wouldn’t replace human judgment on the final approval, consistent with the emphasis throughout this guide on keeping baseline review a deliberate, human-reviewed step, but it could meaningfully reduce the triage burden on large suites with high review volume.
What Won’t Change
Regardless of how the tooling landscape evolves, the fundamental principles covered throughout this guide are likely to remain stable: deterministic rendering environments matter, dynamic content needs deliberate handling, baseline review needs to be a genuine review rather than a formality, and incremental, trust-building rollout beats attempting comprehensive coverage from day one. Tooling will keep improving the mechanics; the discipline required to sustain a trusted Playwright visual regression testing practice over years, rather than months, is a team and process problem that better tooling alone doesn’t fully solve.
A Note on Tooling Version Currency
The specific version numbers, Docker image tags, and library versions referenced throughout this guide (Playwright, pixelmatch, various CI provider syntax) reflect what’s current as of early 2026. Given how actively this ecosystem evolves, it’s worth periodically checking the official Playwright documentation for the latest recommended Docker image tags and API surface before wiring a new suite into CI, rather than assuming version numbers from any single source, including this guide, remain permanently accurate. The underlying principles — deterministic environments, disciplined baseline review, sensible diff tolerance, incremental rollout — are far more durable than any specific version string, and should transfer cleanly even as the tooling itself continues to mature around them.
Recap: The Core Takeaways
If you’re skimming back through this guide before implementation, the handful of ideas that matter most are worth restating plainly. First, deterministic rendering is the foundation everything else depends on — generate and compare screenshots inside the exact same environment, every time, or nothing downstream will be reliable. Second, dynamic content is not an edge case to handle later; it’s the default state of most real applications, and mocking or masking it correctly from the start prevents the majority of flakiness this guide has spent considerable time diagnosing. Third, configuration defaults matter more than most teams initially assume — a handful of settings, tuned once and applied globally, eliminate entire categories of noise before they ever become a debugging session. Fourth, review discipline is a process commitment, not a technical one, and it’s the single factor most correlated with whether a suite remains trusted a year later. And finally, start small and expand deliberately — coverage breadth is far less valuable than coverage reliability, and every mature, trusted suite referenced in this guide got there by proving itself on a narrow slice before earning the investment to grow.
Conclusion
Playwright visual regression testing is one of the highest-leverage additions you can make to an existing Playwright E2E suite, precisely because it catches an entire category of production bugs — layout breaks, CSS collisions, font failures, responsive regressions — that functional assertions structurally cannot see. The API itself, toHaveScreenshot(), is simple on the surface. What separates a visual regression suite that survives and earns your team’s trust for years from one that gets quietly disabled after a frustrating month is everything covered in this guide: disciplined handling of dynamic content through masking and network mocking, generating baselines inside the exact same Docker environment your CI uses, sensible diff tolerance configuration instead of the overly strict defaults, a deliberate and reviewed baseline-approval workflow, and choosing the right granularity — mostly element-level, selectively full-page — for your test suite.
Start small. Pick your two or three highest-value pages or flows, wire up a handful of well-scoped element-level visual tests with proper masking and animation handling, get that running reliably in CI inside a pinned Docker image, and expand from there. A visual regression suite that covers twenty critical components reliably is worth more than one that covers two hundred pages unreliably and gets ignored. Once the discipline and CI plumbing are in place, expanding coverage is cheap — retrofitting reliability into an already-distrusted, noisy suite is not.
Further Reading
- Playwright Official Docs: Visual Comparisons
- Playwright Official Docs: Docker
- pixelmatch — the pixel-diffing library Playwright uses under the hood
- W3C Web Content Accessibility Guidelines (WCAG)
- Percy by BrowserStack
- Chromatic
- Applitools
🔥 Continue Your Learning Journey
Want to go beyond Playwright with Typescript setup and crack interviews faster? Check these hand-picked guides:
👉 🚀 Master TestNG Framework (Enterprise Level)
Build scalable automation frameworks with CI/CD, parallel execution, and real-world architecture
➡️ Read: TestNG Automation Framework – Complete Architect Guide
👉 🧠 Learn Cucumber (BDD from Scratch to Advanced)
Understand Gherkin, step definitions, and real-world BDD framework design
➡️ Read: Cucumber Automation Framework – Beginner to Advanced Guide
👉 🔐 API Authentication Made Simple
Master JWT, OAuth, Bearer Tokens with real API testing examples
➡️ Read: Ultimate API Authentication Guide
👉 ⚡ Crack Playwright Interviews (2026 Ready)
Top real interview questions with answers and scenarios
➡️ Read: Playwright Interview Questions Guide